How MicroStrategy Becomes Premium-Independent
After five years and 1.49 BTC per starting dollar, MicroStrategy's mNAV has compressed from a 6.34× peak to a 0.77× discount, and the accretion flywheel that funded the BTC accumulation can no longer fund the next round. The strategy is load-bearing on a premium that has, for the moment, stopped paying. Here's the structural move that makes the next round of accumulation premium-independent — and amplifies the flywheel for whenever the premium returns.
The argument. A new generation of highly capital-efficient on-chain leverage changes the equation. A DAT that substitutes convertible debt and premium-funded issuance for perpetual tranches ceases to rely on the mNAV premium altogether — and benefits asymmetrically when the premium returns.
The implicit contract
A Bitcoin treasury company exists to deliver more BTC per dollar than a holder could deliver themselves. That is the contract a DAT enters into the moment its stock starts trading at any kind of premium to its underlying Bitcoin NAV. If the company can’t earn that premium back over time, the holder is better off skipping the wrapper and buying BTC directly.
The contract is straightforward. The execution is not. A DAT has three levers, and each carries a cost:
- Premium-to-NAV issuance. When the stock trades above the underlying BTC NAV, the company can issue new shares at that premium and use the proceeds to buy BTC at NAV. Each such issuance is accretive: every dollar of premium translates into incremental BTC per share for existing holders. This is the canonical mechanism.
- Corporate-level leverage. Convertible debt, term loans, and ATM equity programs let the company buy BTC with borrowed dollars. The leverage amplifies BTC’s positive drift — and amplifies its drawdowns by the same factor.
- Operating cash flow. Software-business cash flow can be redirected into BTC purchases. Modest at the margin, but contributes over multiple cycles.
The first two are where the action is. The first requires the market to keep paying a premium for the wrapper. The second requires the company to maintain its debt covenants through Bitcoin’s drawdowns. Both can fail. Whether either fails determines whether the BTC-per-share number grows or stalls.
So the test is empirical: across a full cycle, did the company grow BTC-per-share fast enough to beat what a holder would have gotten just holding BTC? Five years in, there is enough data to answer.
What MicroStrategy actually delivered
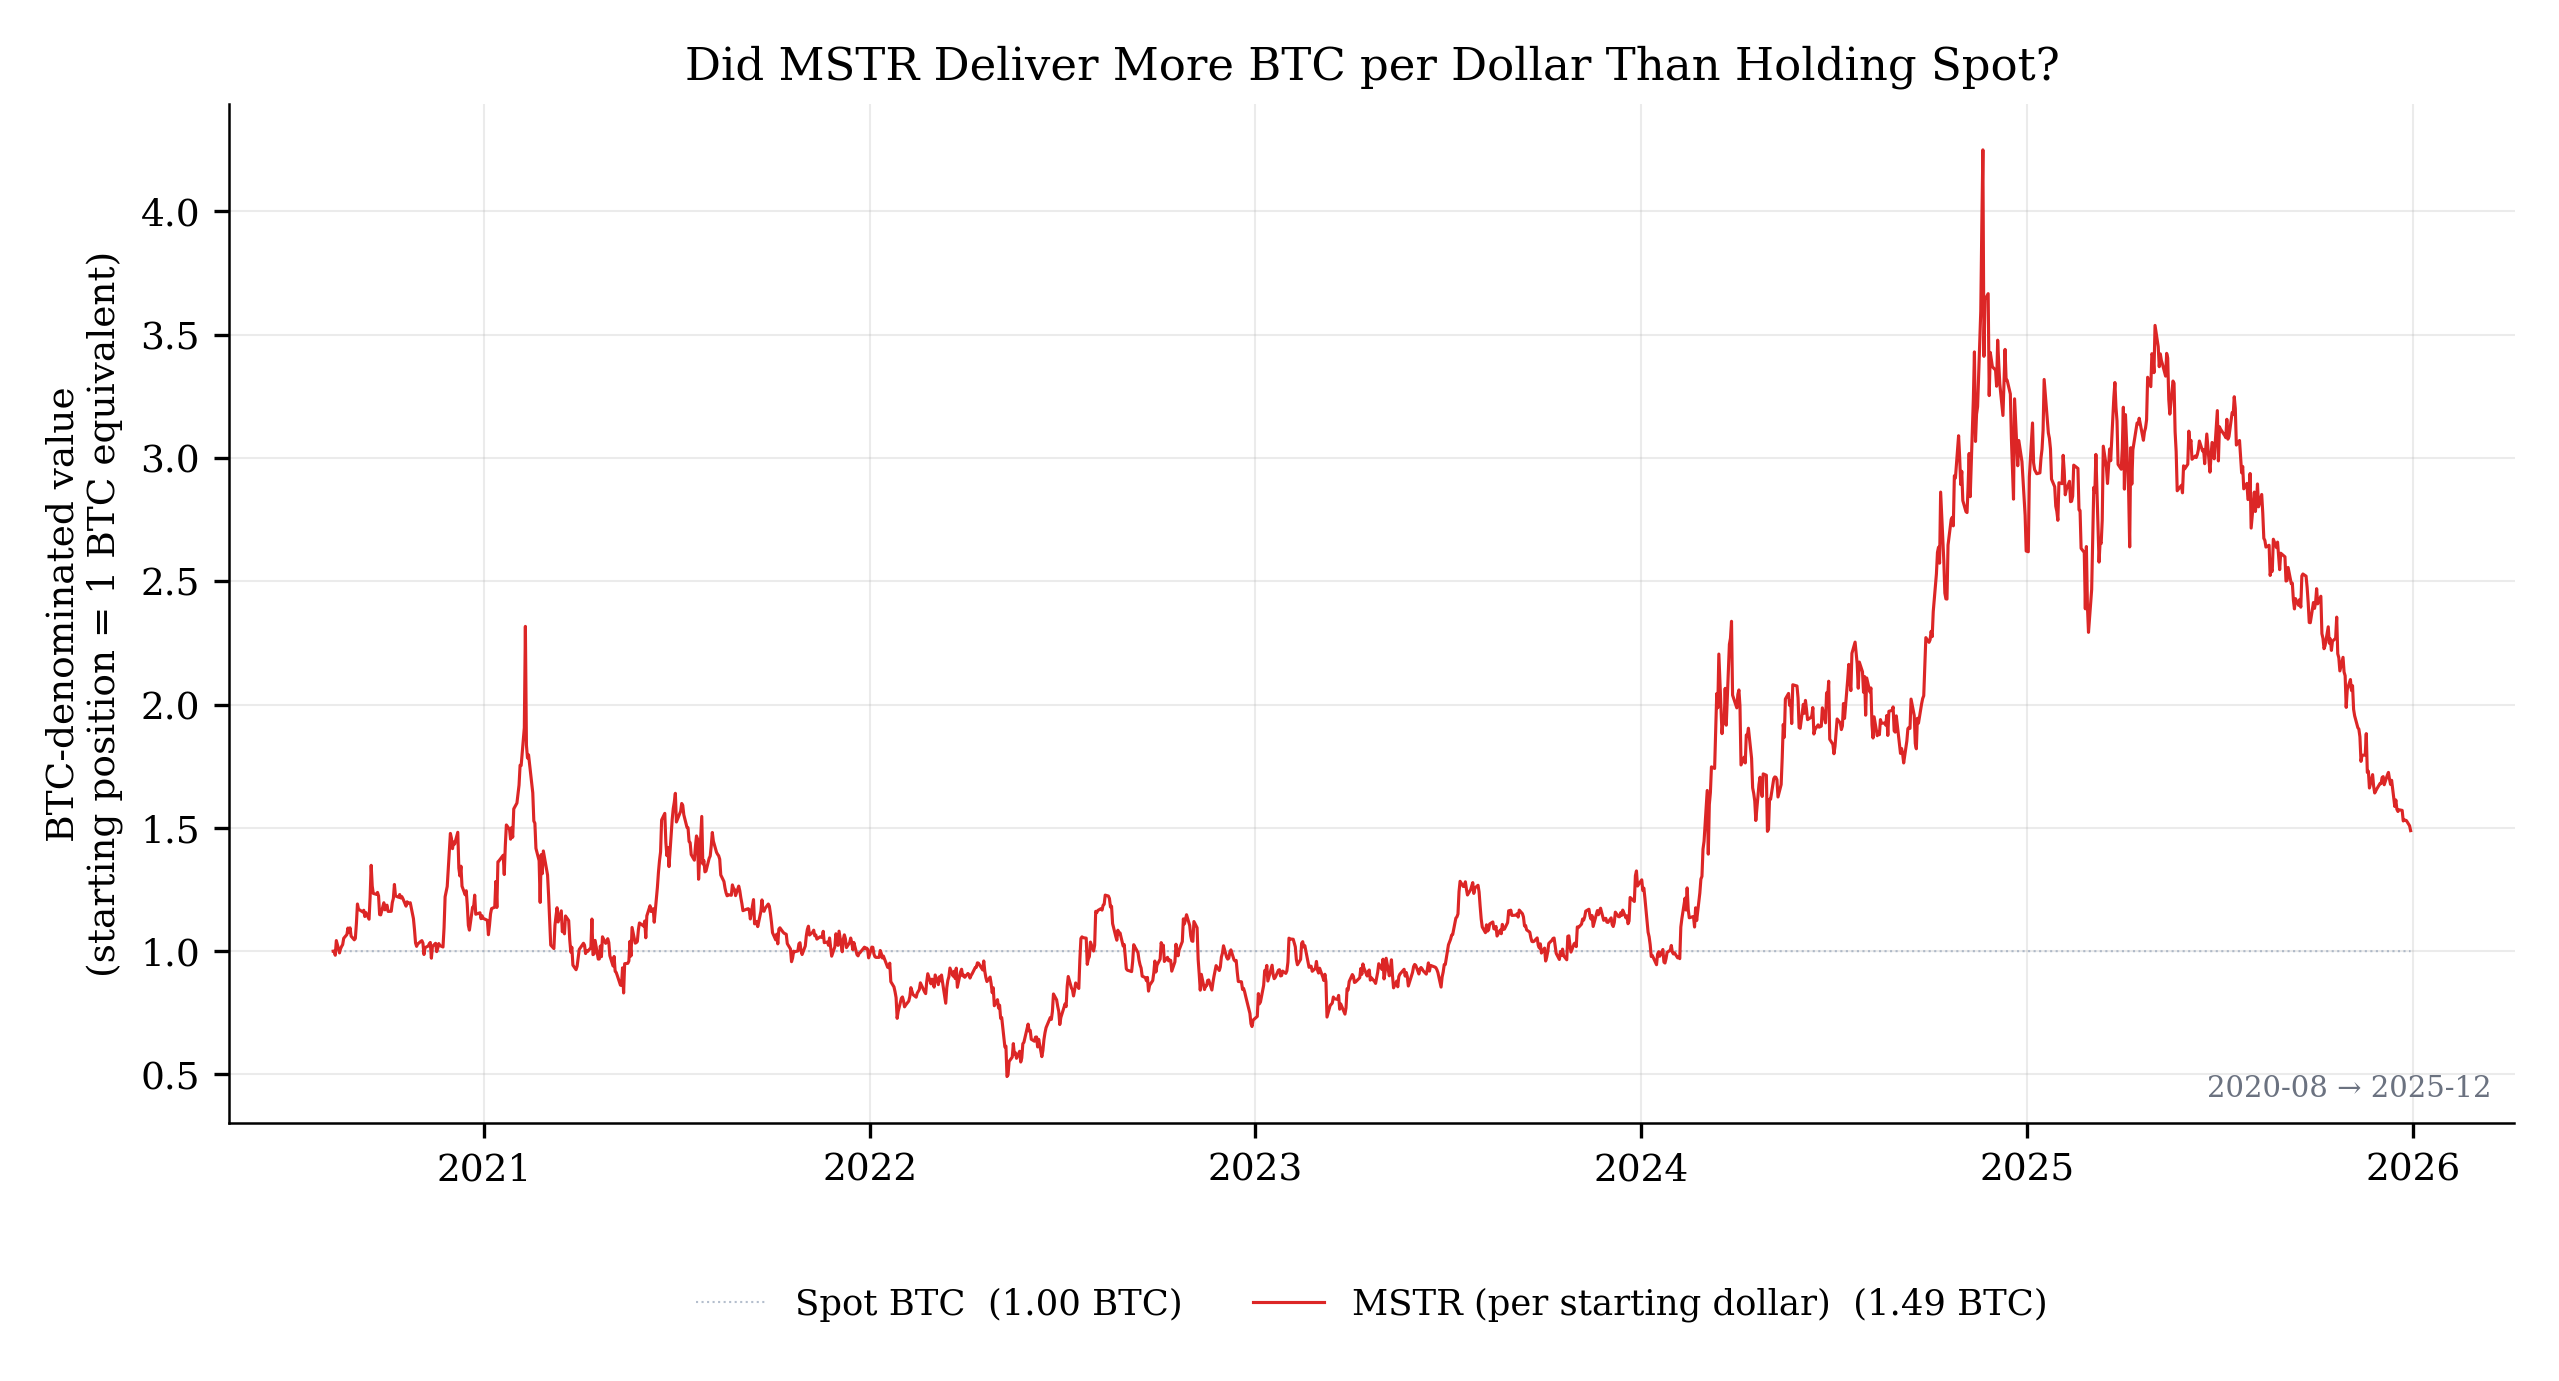
MicroStrategy’s first Bitcoin purchase was in August 2020. From that moment through end of 2025, a holder of $1 of MSTR delivered roughly 1.49× the BTC that a holder of $1 of spot Bitcoin delivered over the same window — a ~7.7% annualized BTC-denominated return.
 |
|---|
| MSTR per starting dollar vs spot BTC, BTC-denominated. Spot stays at 1.0 BTC by construction; MSTR currently at 1.49 BTC, having peaked at 4.21 in November 2024. The implicit contract held: from inception, MSTR delivered ~50% more BTC per starting dollar than passive spot exposure. |
That is the headline. The DAT thesis worked. Capital deployed at NAV by issuing equity at premium, levered by convertible issuance, compounded by the most aggressive corporate-treasury accumulation strategy in capital-markets history — and the holder ends with more BTC per dollar than the alternative.
One nuance worth noting in the timing of that 1.49 number: MSTR’s BTC-denominated outperformance peaked not when the mNAV premium was at its all-time high in late 2020 (6.34×) but four years later, in November 2024 (when mNAV was a more modest 3.3×). The arithmetic explains why. BTC-denominated outperformance is roughly the product of the mNAV ratio change since inception and the BTC-per-share growth since inception. In late 2020, MSTR had been accumulating Bitcoin for only four months, so the second factor was small. Also: MSTR’s starting mNAV was already ~5× because the legacy software business contributed most of the market cap, bundled into the mNAV ratio — leaving only ~1.3× of true premium expansion from there to the 6.34× peak. By late 2024, mNAV was lower, but BTC-per-share had compounded through four years of accretive accumulation, and that compounded base dominated the result. Premium expansion has limited reach without an accumulated base of BTC to scale against.
This is a real and meaningful outperformance. Crediting it correctly is the precondition for any honest comparison of the wrapper to its alternatives.
What it cost holders to get there
The 1.49 BTC headline obscures something important: the path to that number ran through a peak of 4.21 BTC per starting dollar in November 2024. The 65% drawdown from that peak to today’s 1.49 has nothing to do with Bitcoin — BTC itself was within striking distance of its all-time high throughout that decline. The drawdown was almost entirely mNAV compression: the market’s repricing of the premium it was willing to pay for the wrapper.
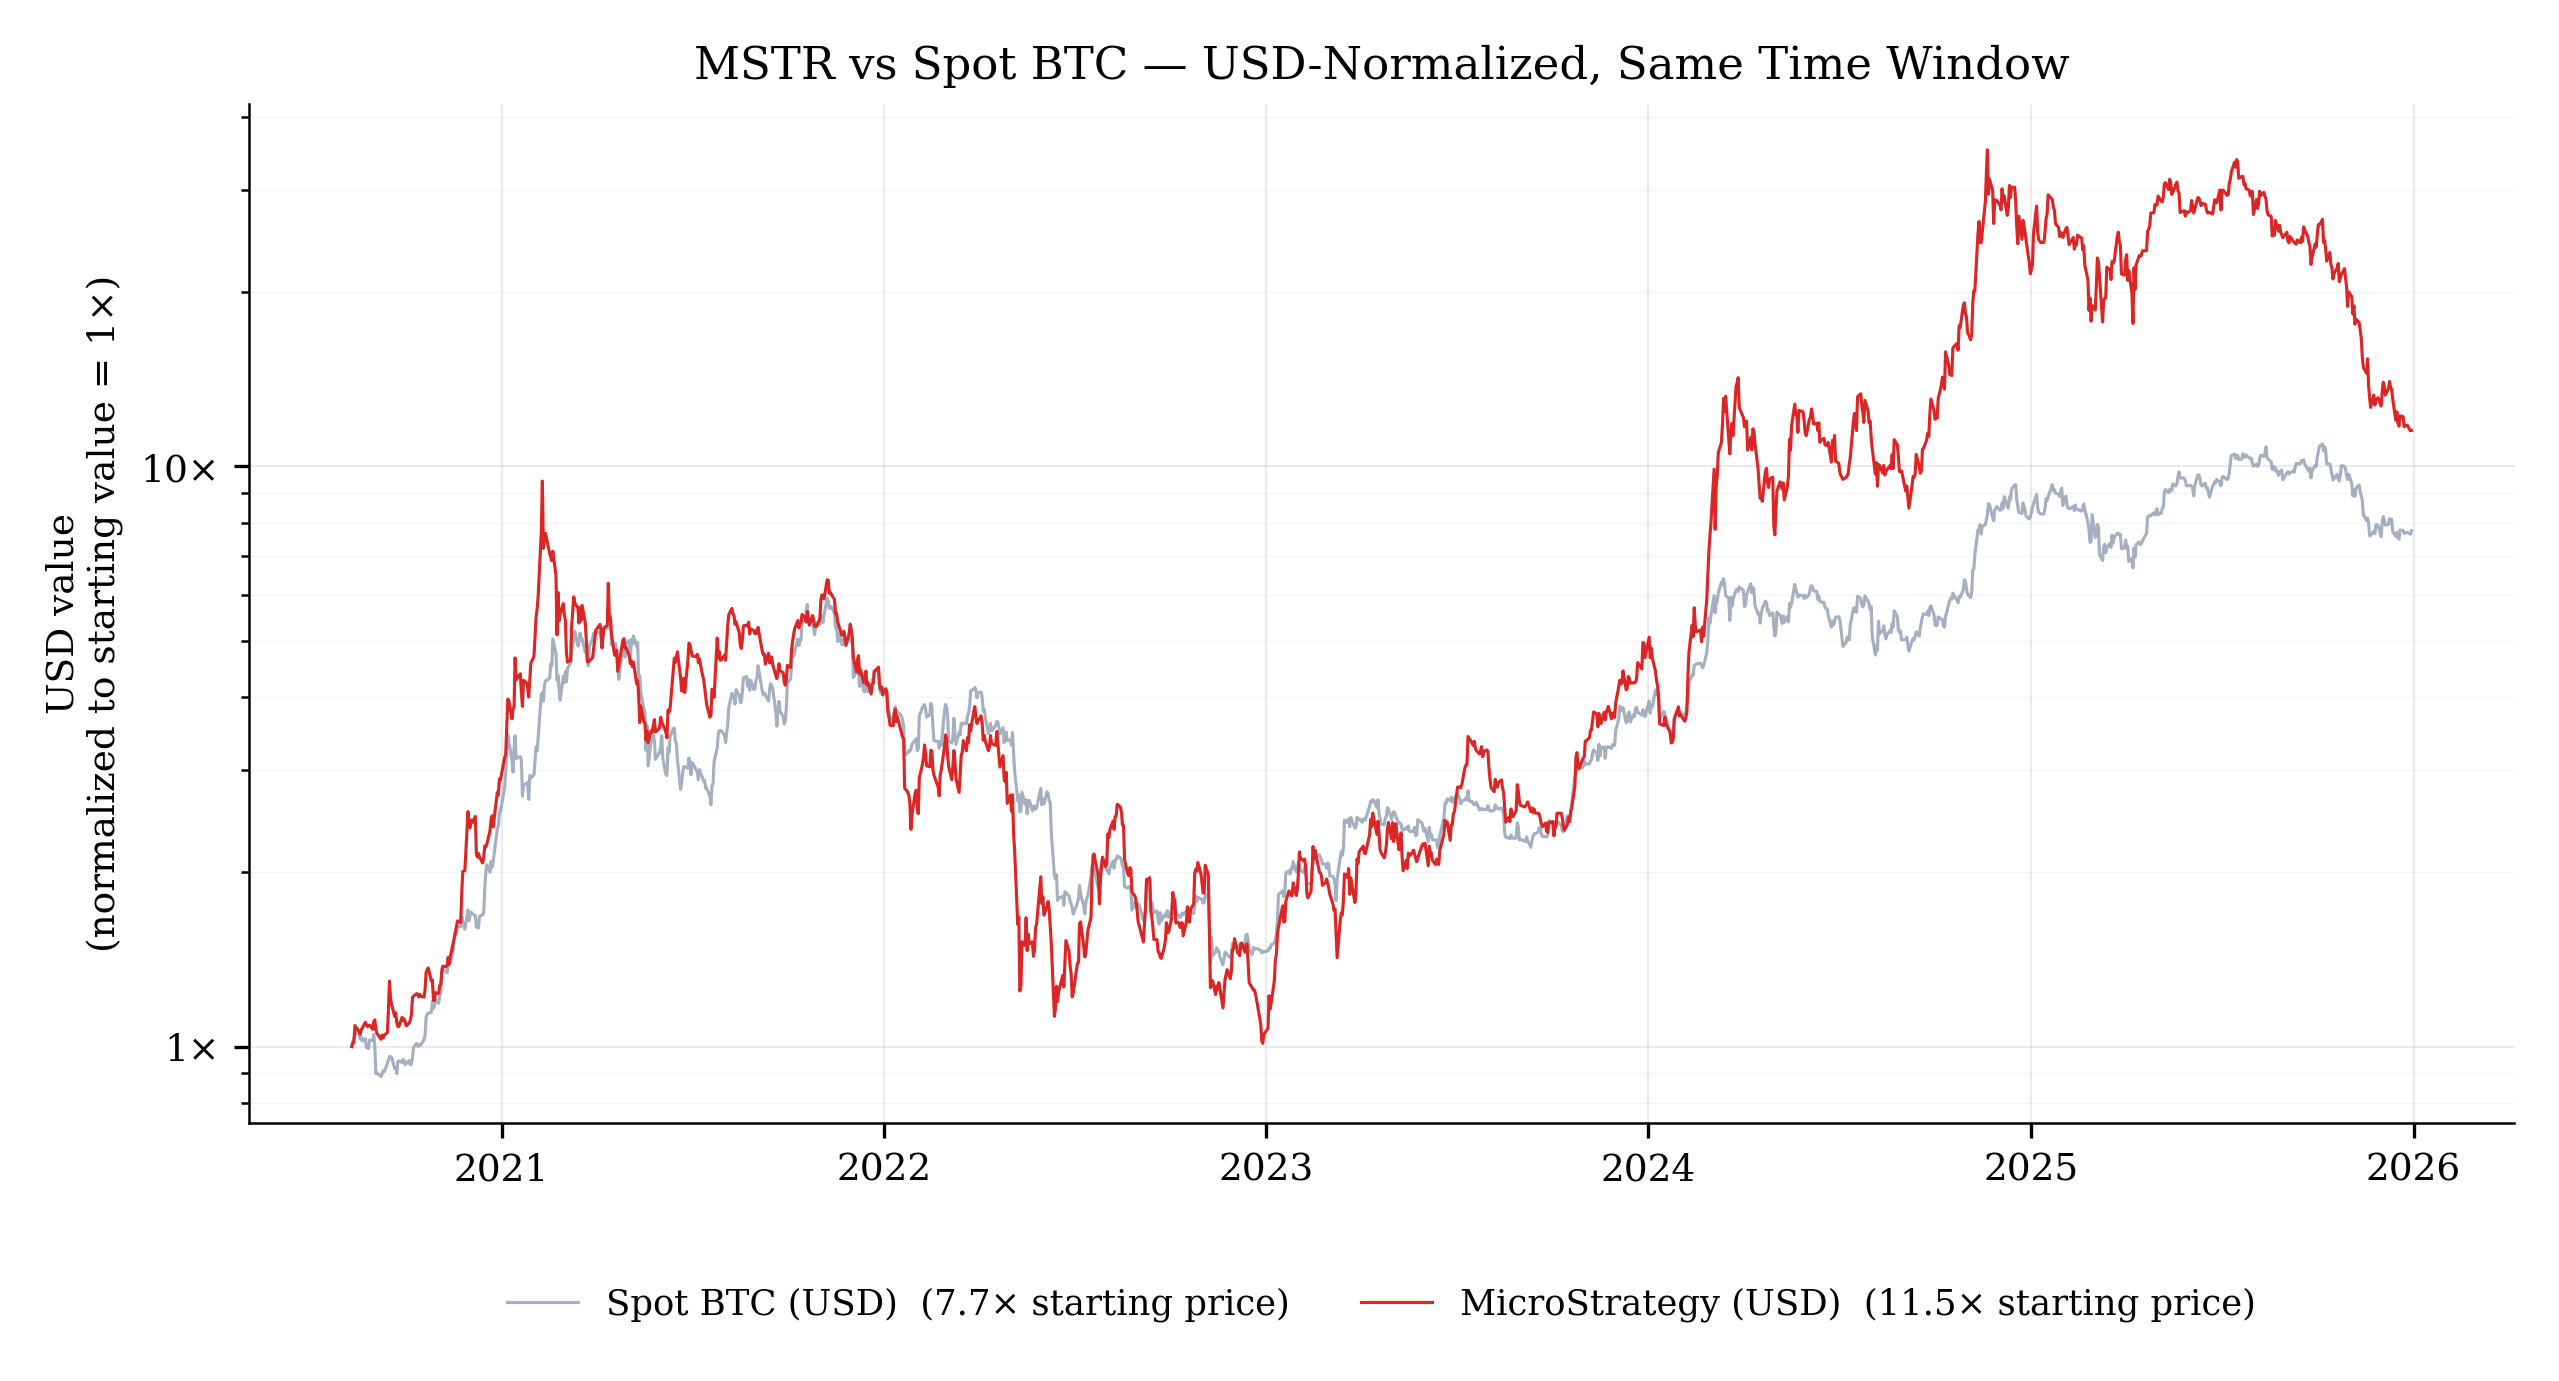
The divergence is visible directly in the USD price action of the two positions:
 |
|---|
| MSTR and spot BTC, USD-denominated and normalized to 1× at inception. The two lines move together when both are responding to BTC’s price action — and diverge during periods when MSTR-specific factors (premium expansion, premium compression, leverage amplification of BTC moves) dominate. The most recent divergence is the most informative: MSTR has fallen by roughly two-thirds from its November 2024 peak while spot Bitcoin has remained close to its all-time high throughout. That gap is wrapper-specific. It is not Bitcoin’s volatility; it is what the wrapper adds on top. |
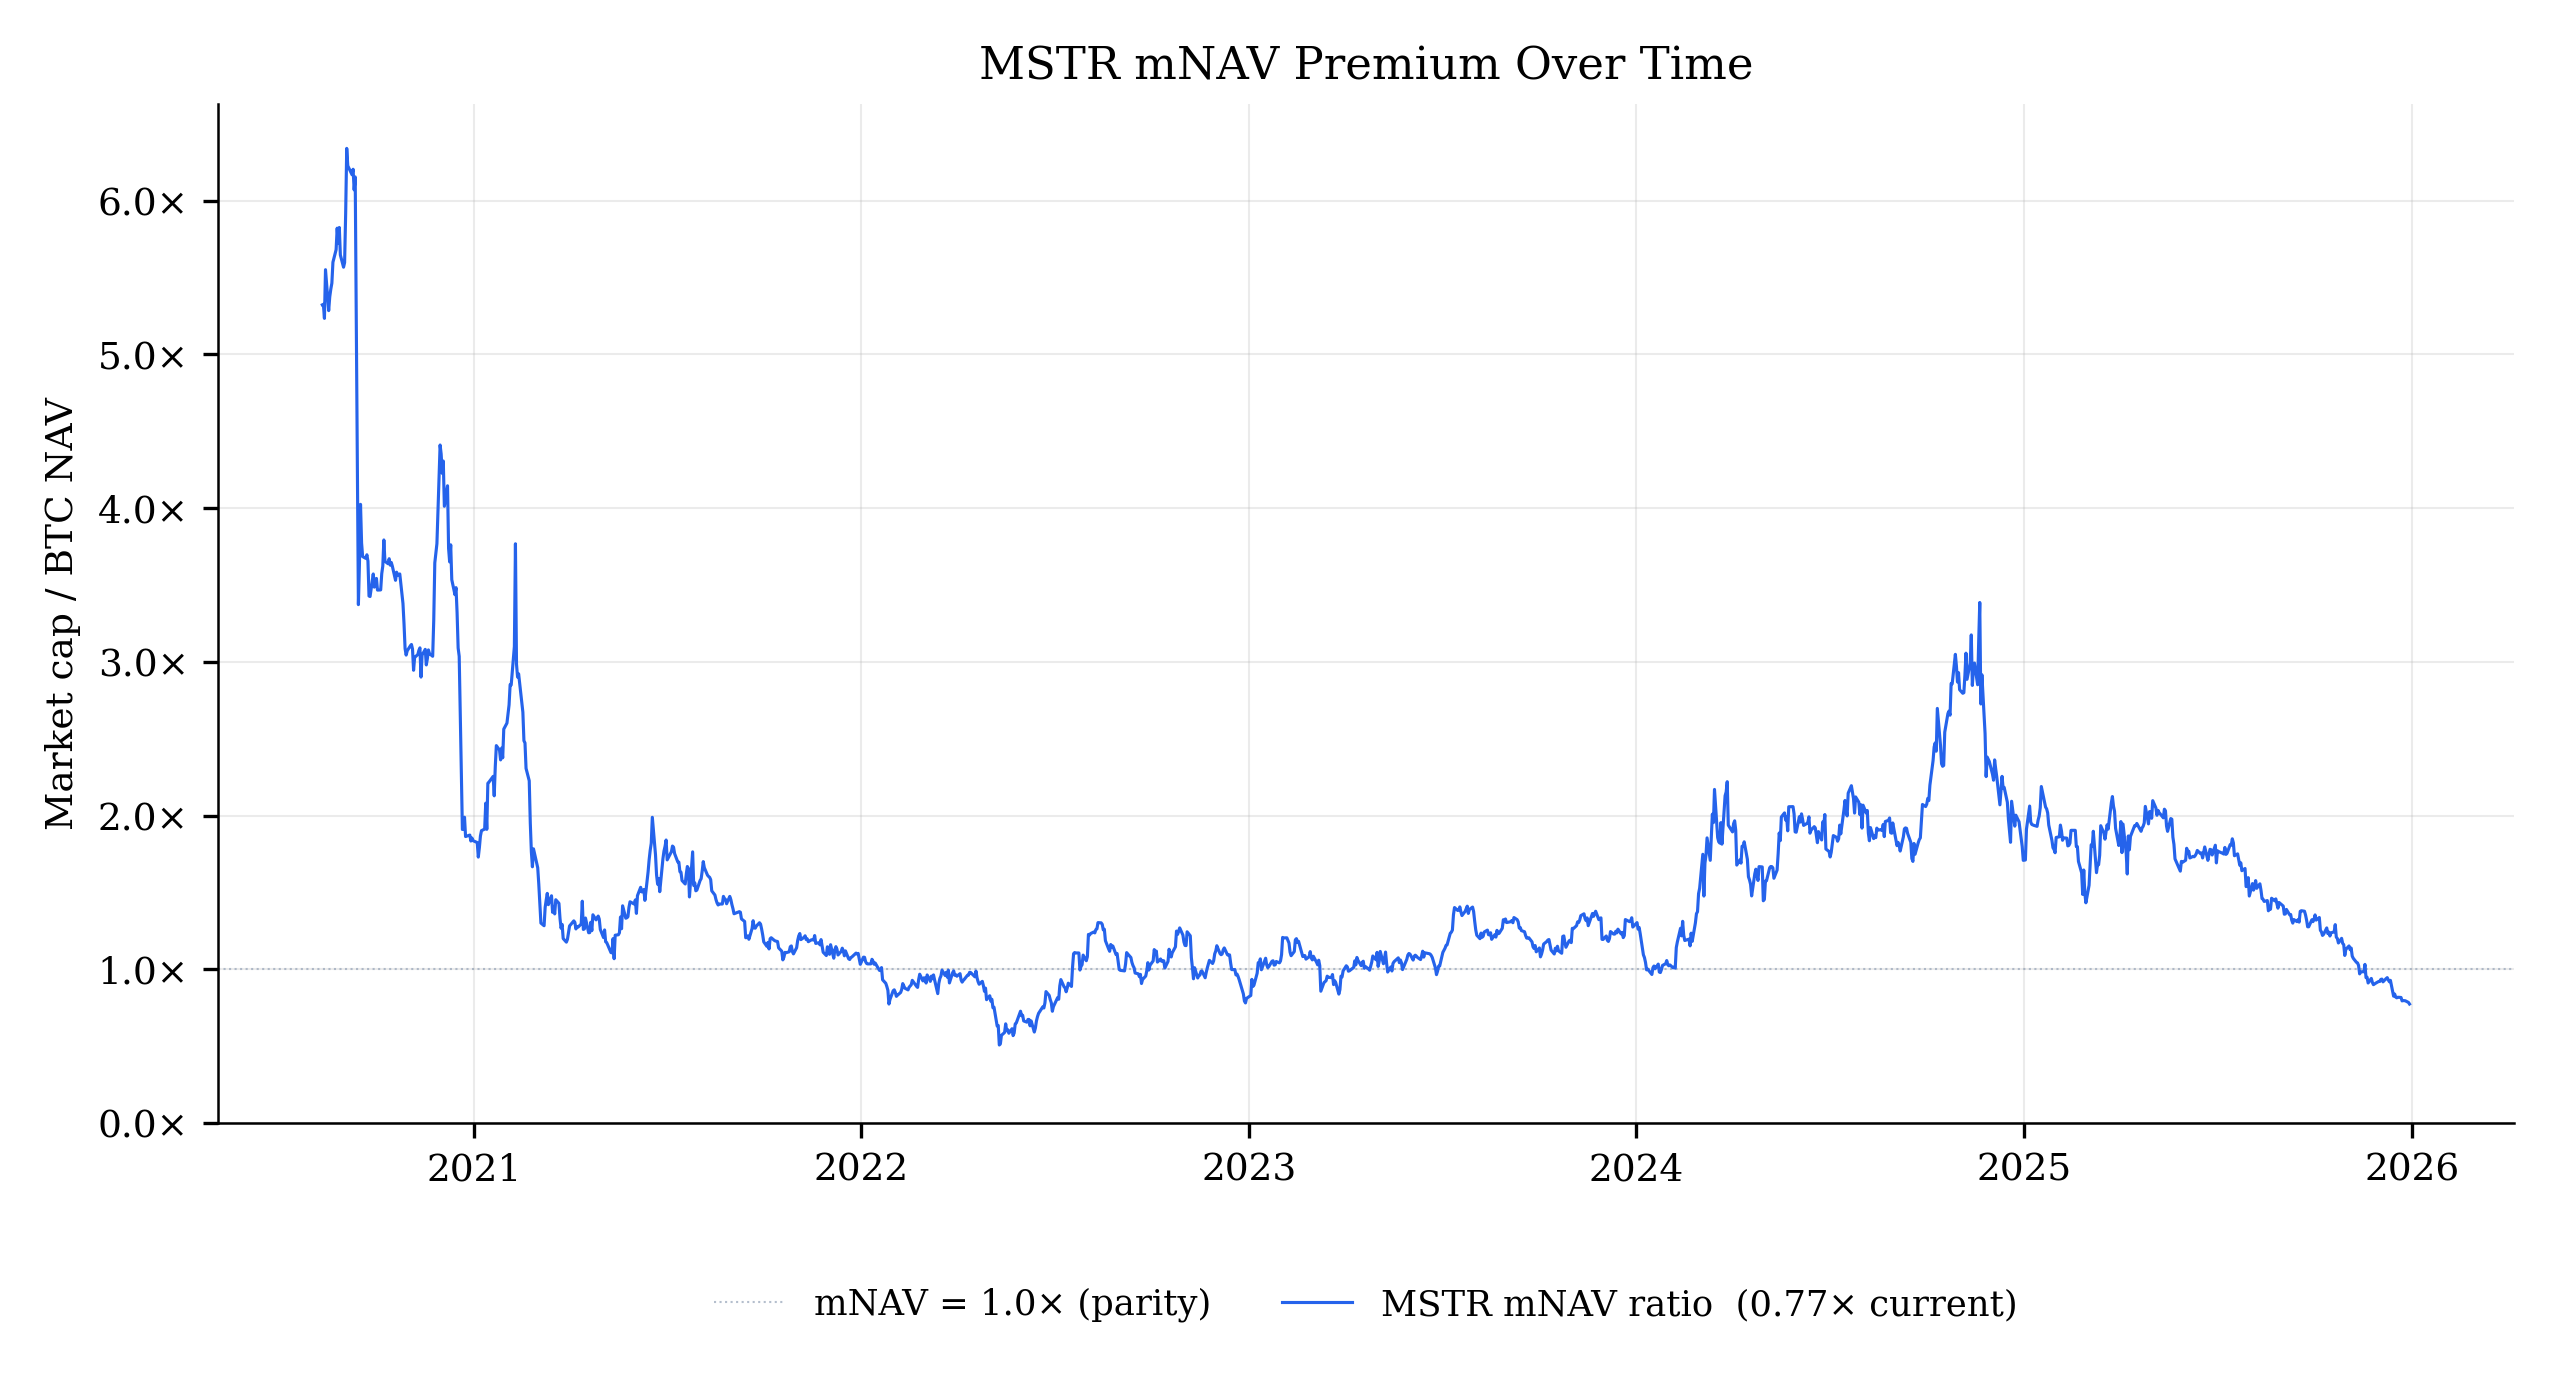
The mechanism behind the divergence is the variability of the premium itself:
 |
|---|
| MSTR’s market cap to BTC NAV ratio (mNAV) since inception. Peaked at 6.34× in late 2020, briefly retouched 3.3× during the ETF-era rally in late 2024, and currently trades at 0.77× — below parity. At a 0.77× mNAV, a buyer of MSTR is paying $1 for $0.77 of BTC backing. |
This is the chart that distinguishes the DAT wrapper from the underlying. There are three layers of volatility a MicroStrategy holder bears:
- Bitcoin’s own volatility. The inherent volatility of the underlying, which any BTC holder bears.
- Corporate leverage amplification. The effective leverage from convertibles and the debt-funded portion of the BTC stack, which amplifies BTC’s moves by something like 1.5–2.5× depending on regime.
- mNAV premium-cycle volatility. The market’s willingness to pay above (or below) Bitcoin NAV for the wrapper. This is the layer that’s invisible to most retail framing and absent from any expense ratio.
The third layer is the cost the wrapper imposes on the holder. It compounds with the first two. A holder who bought MSTR in late 2020 at the 6.34× mNAV peak and held through 2022 lost most of their position to premium compression even though Bitcoin’s price was higher at the trough than at their entry. A holder who bought in late 2024 at the 3.3× mNAV peak watched their position halve within twelve months while Bitcoin was making new highs.
The premium is not free yield. It’s a risk premium the market charges for absorbing the wrapper, and it cycles through expansion and compression on schedules that don’t align with Bitcoin’s own cycles. From a holder’s perspective, what shows up in the realized return is the interaction of all three volatilities — and the third one is the one the holder has the least information about and the least ability to time.
That MicroStrategy currently trades at a 0.77× mNAV — a discount to the value of its Bitcoin — is the cleanest possible signal that the market is repricing the DAT thesis. Every dollar of MSTR purchased today buys roughly $0.77 of BTC. The wrapper’s claim to deliver more BTC per dollar than spot has, for the time being, inverted at the margin.
What happens when the premium disappears?
The accretive-issuance lever — the DAT’s primary value-creation mechanism — depends on a sustained premium to NAV. The arithmetic is direct:
- At mNAV > 1.0: equity issued at premium, BTC purchased at NAV → BTC-per-share rises (accretive).
- At mNAV = 1.0: equity issuance adds BTC proportionally → BTC-per-share is unchanged.
- At mNAV < 1.0: equity issued at discount, BTC purchased at NAV → BTC-per-share falls. Issuance becomes actively destructive to existing holders.
At MicroStrategy’s current 0.77× mNAV, the equity-issuance lever is off — running it would dilute existing holders’ BTC-per-share rather than accrete to it. Two remaining levers stay available: corporate-leverage issuance (convertibles, term debt, ATM-of-preferred) and operating cash flow. Neither, alone, was the primary driver of the BTC-per-share growth the headline number reflects.
If the premium is permanently lower — if the market has structurally repriced the DAT thesis — the strategy can continue to hold the BTC it has accumulated, but its ability to grow BTC-per-share through the accretion mechanism is meaningfully impaired. The flywheel that produced the 1.49× headline number does not run in this regime.
There is one inverse move that does grow BTC-per-share at a discount: buying back shares. A $1 buyback at 0.77× mNAV removes $0.77 of BTC backing from the share base, increasing BTC-per-share for the remaining shareholders. But this is the conceptual inverse of the DAT identity. The company is shrinking the wrapper rather than accumulating through it, and the market would read the move (correctly) as an acknowledgment that the premium model has broken. In practice, DAT operators do not run buybacks at discount; the existential commitment to accumulation is part of the wrapper’s positioning.
STRC: accretion without dilution?
Strategy has been actively building its own solution. The STRX preferred-share series — STRK (8% perpetual preferred, convertible to MSTR common at $1,000/share), STRF (10% fixed perpetual preferred), STRD (10% non-cumulative perpetual preferred), and STRC (“Stretch”) at a variable rate currently 11.50% — was designed to fund Bitcoin accumulation without requiring an mNAV premium. The pitch is simple: preferred shares are senior to common, so issuing them raises capital to buy BTC without diluting common holders’ BTC-per-share, even when mNAV trades below 1.0. The accretion flywheel that broke at the common-equity layer continues at the preferred layer.
STRC is the cleanest example to walk through. It’s a $100-par perpetual preferred paying a variable monthly cash dividend (currently 11.5% annualized) that adjusts to keep the security trading near par. When STRC trades below $100, Strategy raises the rate to attract buyers; when it trades at or above par, the rate holds or decreases. The proceeds fund BTC purchases. By the headline accounting, this delivers exactly what was promised: BTC holdings grow, common share count stays constant, BTC-per-share rises for existing common holders.
STRX allows for accretion at the common BTC-per-share level — but it also introduces a potential insolvency death spiral that didn’t exist before. The accretion is mechanical: each dollar raised buys BTC without diluting common share count. The new risk is architectural: perpetual cash obligations against a volatile asset, no protocol-level mechanism to reduce supply, a self-reinforcing failure mode under sustained drawdown. Pre-STRX MSTR couldn’t go to zero from a BTC drawdown. Post-STRX MSTR can.
Where it actually dilutes. The dilution is real but indirect — it lives in the dividend stream, not the share count. The cash for STRC dividends must come from somewhere: operating cash flow (modest), new STRC issuance (Ponzi-like), BTC liquidation, or common issuance at discount. At any non-trivial scale, Strategy effectively chooses how to dilute, not whether. The net economic mNAV available to common — the residual claim on the BTC stack net of preferred obligations — shrinks with each new issuance, even when headline BTC-per-share grows.
The cost on common scales with the leverage delivered. With E = common equity, P = STRC outstanding, and L = (E + P) / E, the effective annual cost per dollar of common is (L − 1) × 11.5%. The 11.5% is the rate on the borrowed dollar; what common actually bears is the leverage-scaled version:
- L = 1.1×: 1.15% on common
- L = 1.33×: 3.80% on common
- L = 1.6× (MSTR’s vol-based realized leverage, 2020–2025): 6.90% on common
Forward, that dividend rate is also the hurdle BTC must clear in USD terms. The exact breakeven BTC return for common is g = 11.5% × (1 − 1/L) — about 4.3% at L = 1.6× (MSTR’s vol-based realized leverage over 2020–2025), rising toward 11.5% as leverage approaches infinity. Above this rate, leverage is forward-accretive at any L. Below it, common erodes regardless of how much leverage is applied. Over the 2020-2025 window spot BTC delivered ~46% USD CAGR — well above the hurdle, making STRC issuance highly accretive in hindsight. But the rate-locked obligation runs forward into any future BTC regime.
How it breaks down. The architecture’s load-bearing assumption is that STRX supply will never need to contract. There is no protocol-level redemption — STRX holders can exit only by selling to another buyer in the secondary market, and Strategy isn’t obligated to buy back at par. Aggregate supply is fixed at issuance; the dividend obligation persists in full regardless of BTC performance, holder behavior, or Strategy’s cash position.
Worse: the perpetual yield-stream structure makes inventory sticky in normal times and prone to stampede in stress. STRX holders own a yield stream, not a principal-plus-yield bundle — so when Strategy is paying, they have no incentive to exit (the yield is the asset). When Strategy’s ability to pay comes into question, all of them want to exit at once, and there’s no graceful exit path. The architecture generates its own stress dynamic through this stickiness asymmetry.
This rigidity surfaces as three downstream failure modes when stress arrives:
-
Cash flow becomes unresolvable. Dividends are paid monthly in cash. Strategy’s software-business operating cash flow is modest (~$50–100M/year). At any non-trivial scale of STRX, the dividend stream exceeds operating cash flow — and because supply can’t contract, the only resolution paths are continuous reliance on (a) new STRX issuance (Ponzi-like, only while demand exists), (b) BTC liquidation, or (c) common issuance at discount (directly dilutive).
-
Leverage can’t auto-deleverage. A 50% BTC drawdown is ~80% common loss at L = 1.6× (MSTR’s vol-based realized leverage), and scales linearly with leverage. In stress, leverage stays at peak exactly when it should reduce — because STRX supply can’t shrink. Strategy can’t choose to reduce leverage without spending cash to buy back STRX, which it doesn’t have in stress.
-
Cost of capital spikes in the worst environment. STRC’s variable rate adjusts mechanically to keep price at par. In a drawdown, marginal holders sell, STRC trades below $100, the rate ratchets up to attract new buyers — and the new rate applies to all outstanding, not just newly issued. Strategy’s existing dividend burden grows precisely when its cash-flow capacity is weakest — the rate spike and the cash-flow constraint feed each other.
The synthesis is real default risk. Bitcoin draws down, the cash flow obligation persists in perpetuity, there’s no organic mechanism to reduce it, and the three constraints compound to force one of three exit paths: BTC liquidation, common issuance at discount, or default on the STRX dividend. This is the gap between STRX’s architecture and the asset it’s funding — a perpetual rigid claim against a volatile asset that the issuer can neither shrink nor smooth.
This also explains common’s mNAV discount. MSTR’s current 0.77× mNAV isn’t only the market discounting future BTC growth or pricing the wrapper-cost overhang. It’s the market pricing in the default-risk asymmetry the rigidity creates: the BTC stack can drop, but the STRX obligation can’t. Common holders sit behind a rigid claim against a volatile asset, and the discount is the rational price of that asymmetric tail risk.
What it costs. Per $1B of STRC outstanding: ~$115M annually in cash dividends, paid in perpetuity, transferring BTC value from common holders to preferred holders. The 8–11.5% range across the STRX series is the market price Strategy pays for leverage capital — set by credit risk premium, refinancing cycle exposure, and capital-markets distribution dynamics. It is the corporate wrapper’s pricing of leverage, on display.
The STRX series, taken together, is a complicated and potentially costly solution to the mNAV-premium problem — and not a complete one. It substitutes a market-priced equity premium (which can compress to zero but carries no fixed obligation) for an architecturally rigid one (which cannot shrink and carries a perpetual cash claim against a volatile asset). The premium problem is escaped at the common-equity layer; new fragilities — and a real default-risk asymmetry — take its place at the preferred layer.
The structure is also a de facto tranching: MSTR common bears the leveraged BTC equity; STRX preferreds collect senior USD yield. This wasn’t accidental — Strategy engineered STRX deliberately, having observed the mNAV-premium dependency, understood it was structural rather than transient, and built the preferred-share stack to substitute for the premium when it fades. That workaround introduced its own insolvency-spiral risk. The wrapper layer doesn’t admit a clean solution to the leverage-funding problem; Strategy’s own engineering response is the proof. The substitution thesis is already in motion at the corporate layer — what remains is the layer itself.
This is the dimension where the architectural comparison becomes sharpest. A DAT’s strategy is conditional on the market’s continuing willingness to pay for the wrapper. When that willingness fades, the strategy’s primary lever fades with it. Protocol-native leverage carries no such conditionality.
The architectural alternative
The natural comparison is to a position that delivers the same first-order outcome — leveraged Bitcoin exposure — without bundling the wrapper risk. Until recently this comparison was largely theoretical: no retail-accessible vehicle delivered moderate leverage on Bitcoin without inheriting either the wrapper-level costs the DAT structure imposes or the daily-rebalance path-dependence that disqualifies leveraged ETFs from buy-and-hold use. 2factor finance’s perpetual-tranching architecture produces BTC-Jr — a 1.33× leveraged Bitcoin position with a bounded financing cost of (rf + 1%) / 3 per dollar of Jr equity and no daily-rebalance friction. The moderate-leverage line in the comparison below is therefore no longer a hypothetical reference point; it’s a deliverable position.
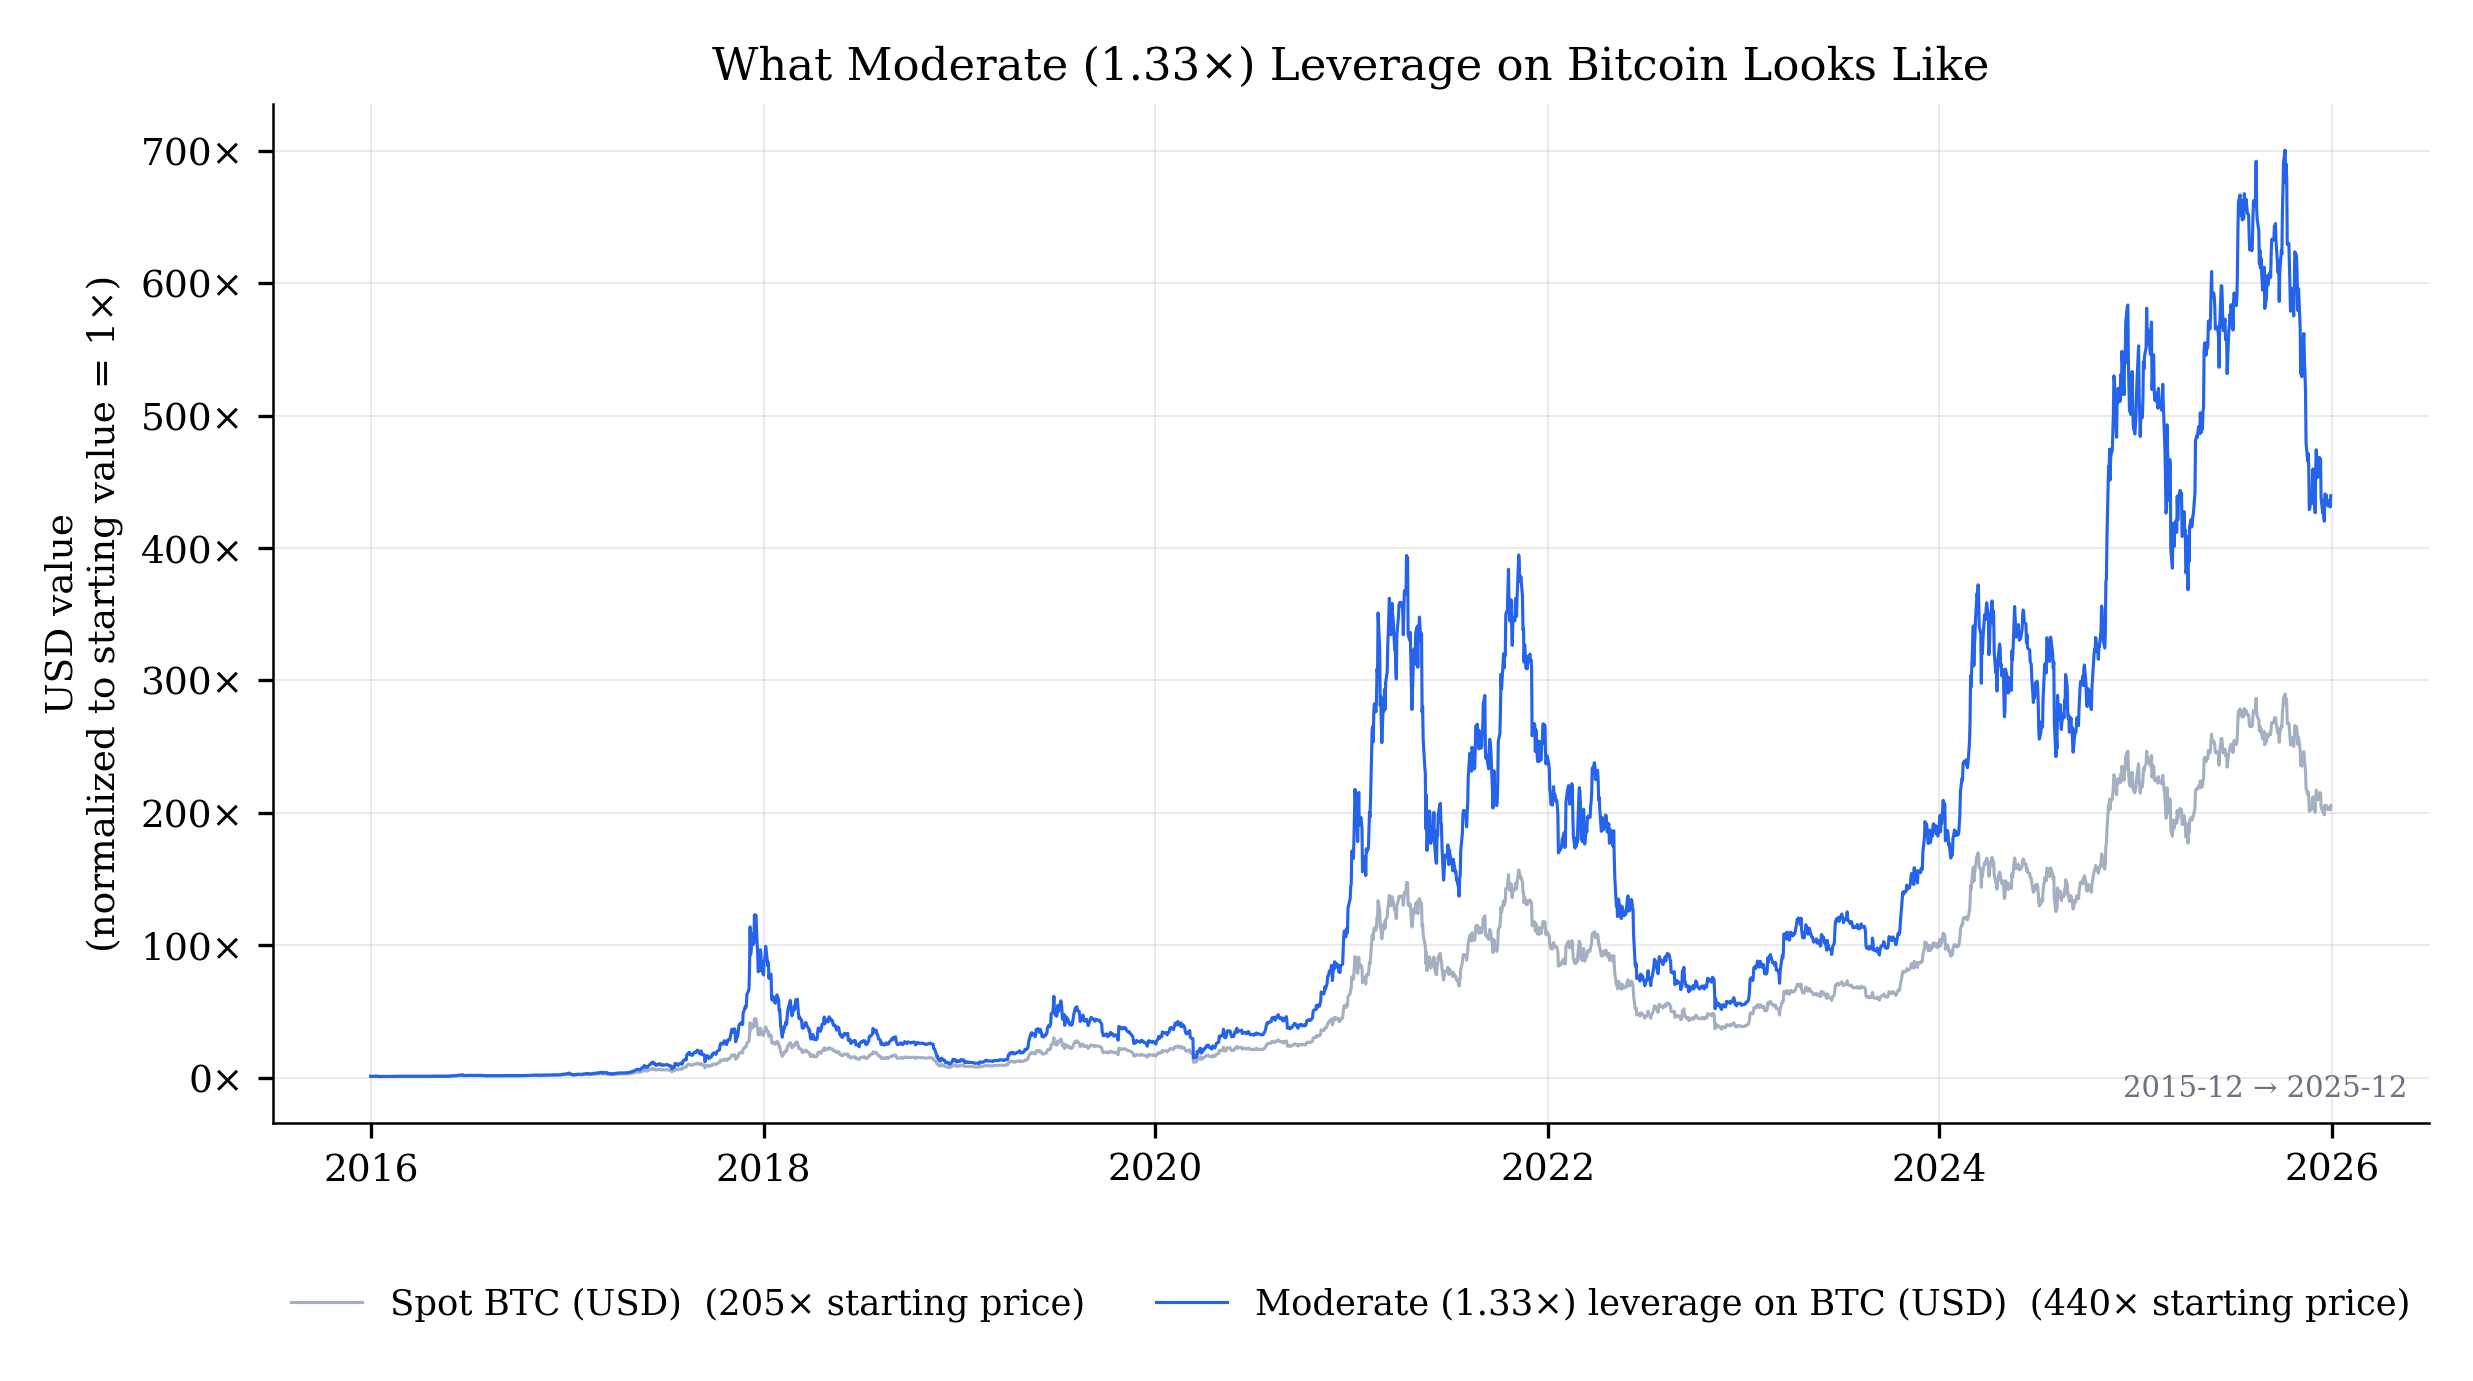
Before introducing the three-way comparison, it’s worth seeing what moderate 1.33× leverage on Bitcoin looks like as a position on its own. The 10-year window of Bitcoin’s history covers multiple full cycles and is the cleanest way to see how the position behaves across regimes:
 |
|---|
| Spot BTC vs moderate 1.33× leverage on Bitcoin, USD-denominated and normalized to 1× at the start of the window. Both lines track BTC’s price action across the full 10-year window — multiple complete bull/bear cycles. The leverage line runs amplified above spot in bull cycles and falls further below in bear cycles. The position’s volatility is BTC’s volatility scaled by the leverage ratio — substantial, but bounded by Bitcoin itself. Over Dec 2015 – Dec 2025: spot ends at ~205× starting price, the leverage line at ~440× — the compounding advantage of moderate leverage on a positive-drift asset, made concrete. |
Restricted to MicroStrategy’s specific window (Aug 2020 onwards), that same position would have delivered approximately 1.31 BTC per starting dollar — within rounding distance of MicroStrategy’s 1.49.
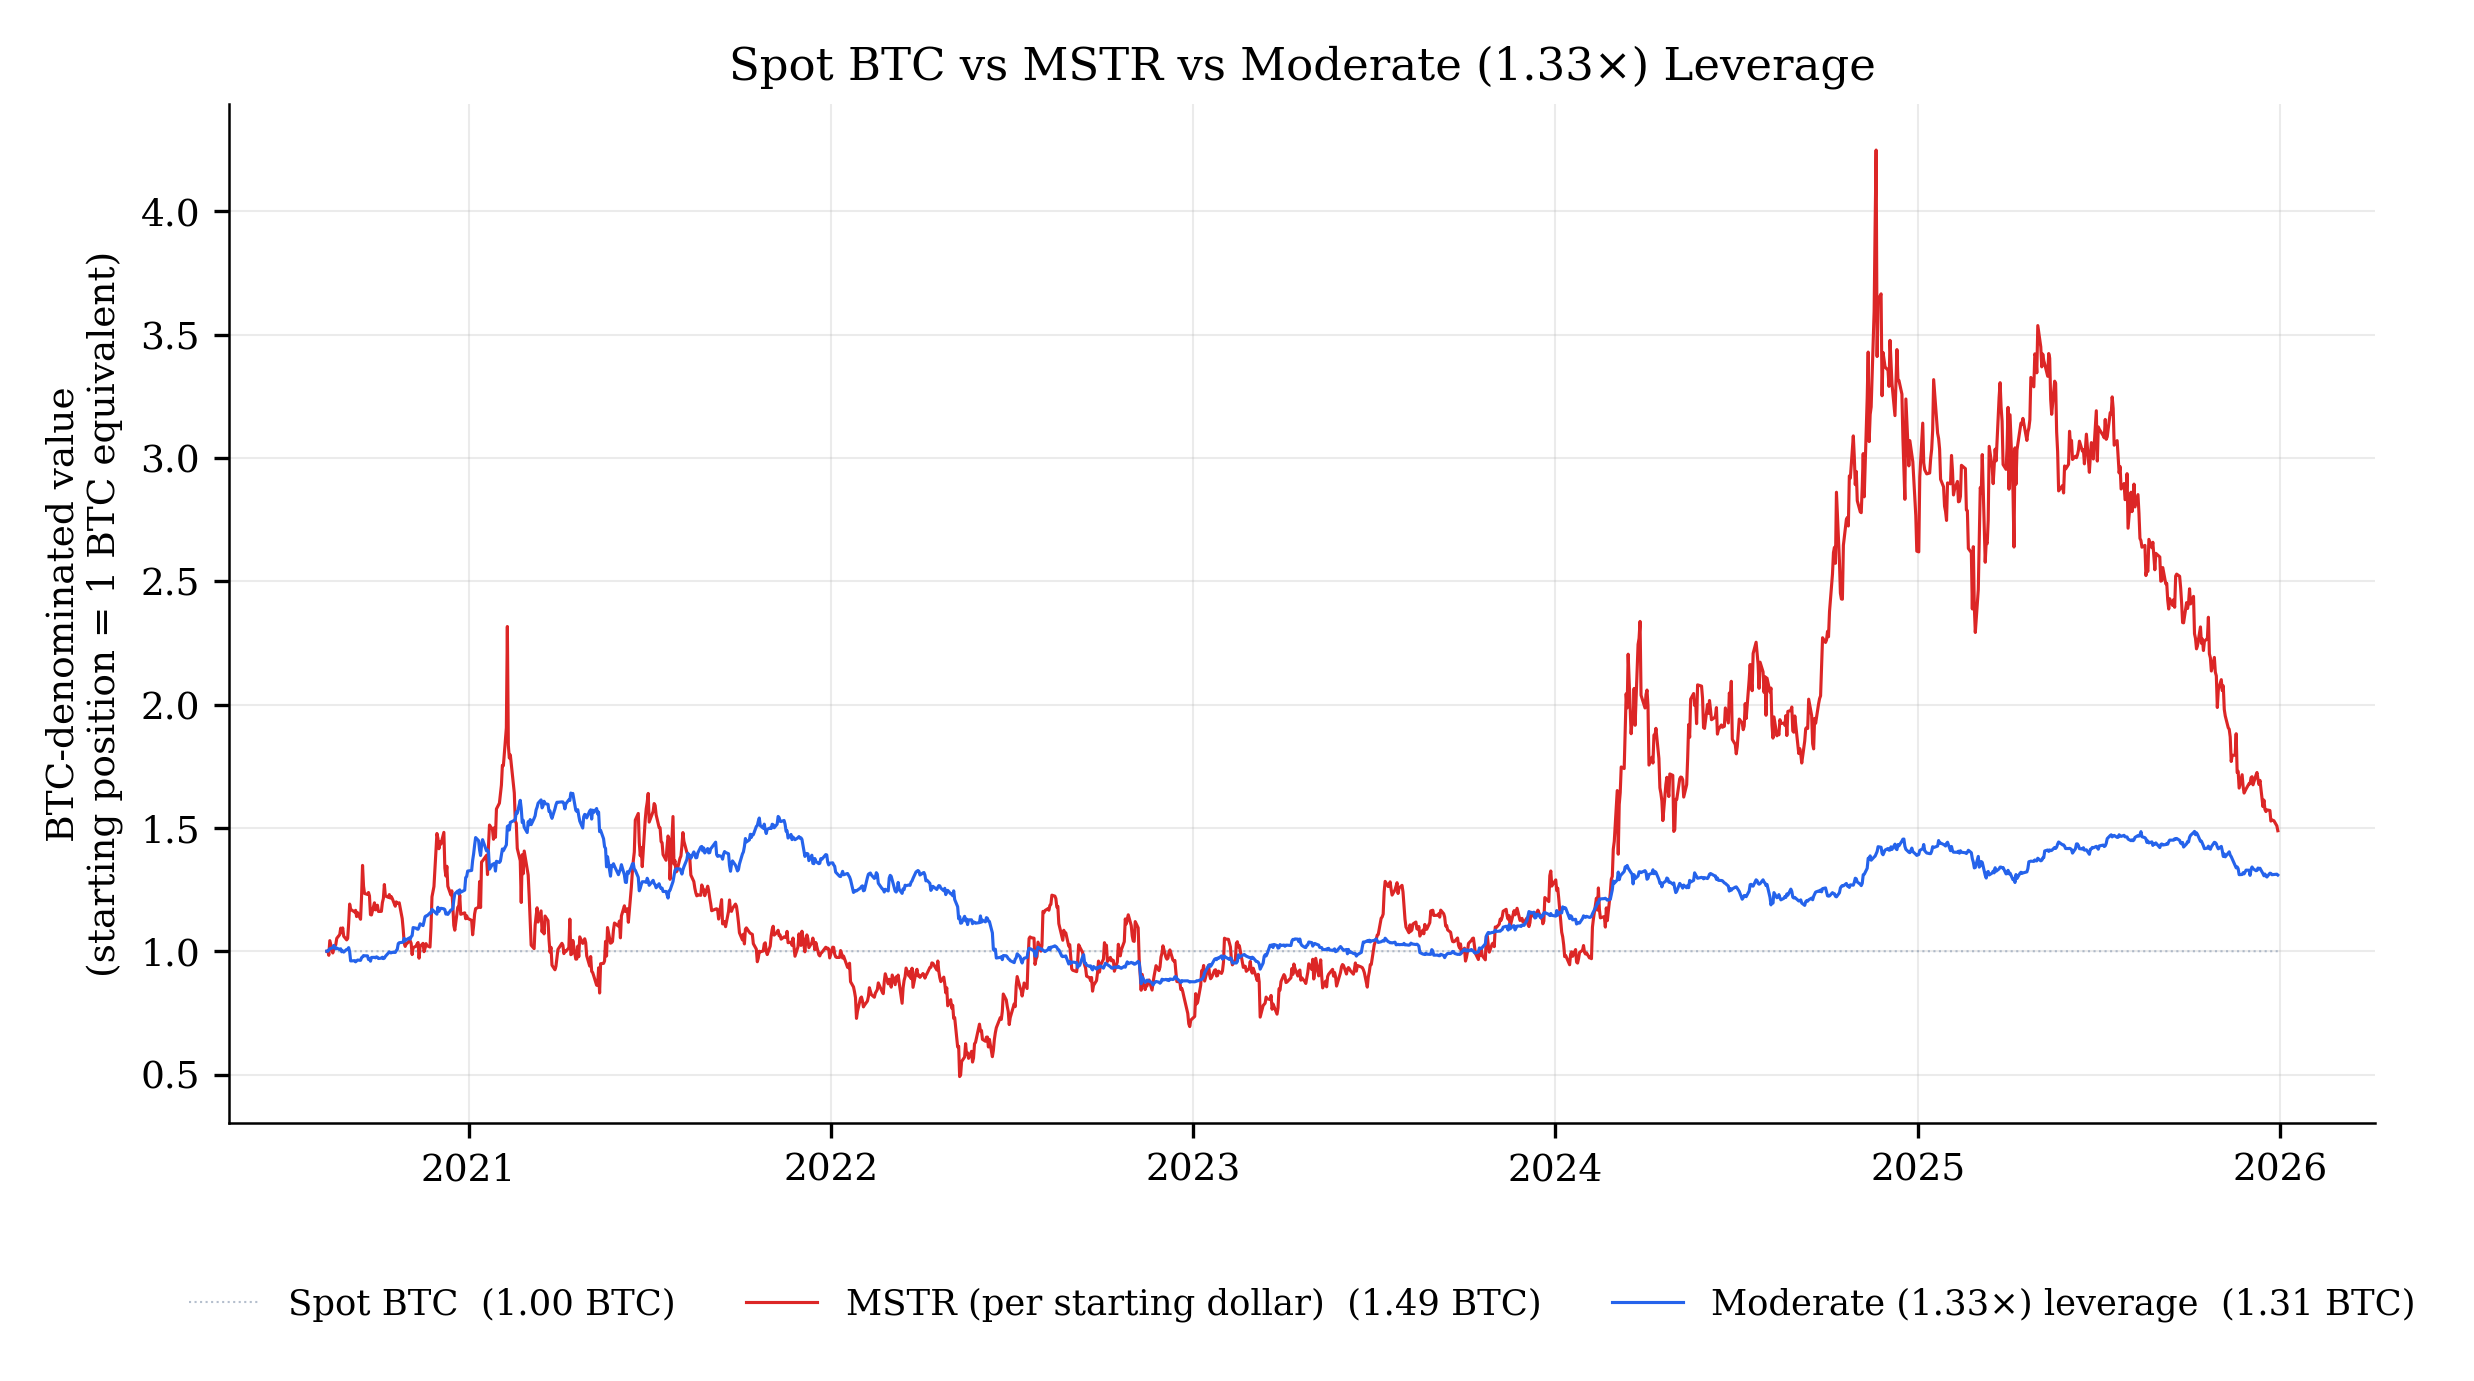 |
|---|
| Three-way comparison over the same window: spot BTC, MSTR per starting dollar, and moderate (1.33×) leverage on Bitcoin. The end-state values are within striking distance of each other (MSTR 1.49, moderate leverage 1.31), but the realized paths are dramatically different. The leverage line’s volatility is BTC’s own volatility scaled by 1.33; MSTR’s includes that plus the wrapper layer. |
The two end-state numbers are similar enough that a casual reader could conclude the wrappers are interchangeable. They’re not. The realized paths are categorically different. The 1.33× line tracks Bitcoin’s price action scaled by the leverage ratio — a holder’s path-dependent risk is bounded by BTC’s volatility. MicroStrategy’s path includes the same BTC volatility, plus corporate leverage amplification, plus the premium-cycle volatility that is independent of Bitcoin.
Stated more directly: a Bitcoin holder is already speculating on the outcome of Bitcoin. That is the entire point of the position. What the holder does not want is to also have to speculate on the path the position takes to that outcome, or on the future of an mNAV premium that has nothing to do with Bitcoin itself. MSTR layers both additional speculative dimensions onto the underlying bet — the premium can expand or compress for reasons unrelated to Bitcoin (capital-markets sentiment, mandate-driven flows, broader DAT repricing, macro factors). A holder of a perpetual-tranching position like BTC-Jr is not taking those bets at all. The position’s NAV is defined mechanically by the protocol; the Bitcoin thesis is the only thesis the holder is betting on.
The cost is quantifiable:
| Position | USD CAGR | Annualized vol | Sharpe ratio |
|---|---|---|---|
| Spot BTC | +46.4% | 58.3% | 0.73 |
| Moderate 1.33× leverage | +54.0% | 77.5% | 0.65 |
| MicroStrategy (MSTR) | +57.7% | 93.4% | 0.57 |
Daily-return basis, USD-denominated, same Aug 2020 → Dec 2025 window. Sharpe ratios computed with rf = 4%.
The headline outperformance — MSTR’s +11.3pp of USD CAGR over spot — comes wrapped in an additional 35 percentage points of annualized volatility (93.4% vs 58.3%). The Sharpe ratio falls below spot’s — 0.57 vs 0.73 — meaning each unit of risk an MSTR holder bore was less productively compensated than just holding Bitcoin directly.
The gap between MSTR (93.4%) and moderate 1.33× leverage (77.5%) isolates the wrapper layer specifically: roughly 16pp of pure wrapper volatility with no commensurate excess return to defend it. That 16pp is what the holder pays for the corporate-treasury structure — premium-cycle volatility, dilution timing risk, convertible-covenant exposure — bundled together and embedded in realized return. For a holder who could realize the exit at the moment of their choosing, that bundle costs them nothing. For a holder whose exit horizon is set by anything other than premium-cycle optimization, it is the dominant determinant of their outcome.
The cost is also quantifiable in a single number. If MSTR’s leverage had been delivered with the Sharpe profile of clean 1.33× leverage on Bitcoin — same vol exposure, no wrapper layer of unrewarded volatility — the same risk profile would have yielded approximately 7 percentage points more annualized USD return than the wrapper has actually delivered (0.65 × 93.4% + 4% ≈ 64.7%, against an actual 57.7%). On a Bitcoin treasury that has spent most of its life valued in the tens of billions of dollars, 7pp annualized compounds to several billion dollars per year of value the wrapper structure has consumed — the dollar-magnitude equivalent of the Sharpe penalty.
A Sharpe difference of 0.57 vs 0.65 looks small enough to dismiss at the retail level. At institutional scale it isn’t. The largest pools of capital in the world — pensions, endowments, sovereign-wealth funds, fund-of-funds, allocator-driven family offices — size positions on the basis of risk budgets rather than dollar amounts. For a fixed allocation to “Bitcoin exposure” expressed in portfolio-risk units, position size scales inversely with the vehicle’s volatility. At MSTR’s 93.4% annualized vol, a given risk budget sizes to one position; at the moderate-leverage line’s 77.5% vol, the same risk budget sizes to a position roughly 20% larger. Combined with the Sharpe improvement (≈14% more return per unit of risk), the higher-Sharpe vehicle captures roughly 13% more dollar return per unit of portfolio risk allocated. On a sovereign-wealth fund considering Bitcoin exposure at meaningful scale, that compounds to hundreds of millions to billions of dollars per year of additional return for identical risk.
The categorical effect is sharper still. Most institutional mandates carry minimum Sharpe thresholds below which an asset class can’t be included at all — commonly around 0.5. MSTR at 0.57 barely clears the threshold; the moderate-leverage profile at 0.65 clears it comfortably. The architectural shift moves Bitcoin exposure from “marginally allocatable” to “comfortably allocatable” for entire allocator categories — and the implied pool of new capital that becomes available at the new Sharpe floor dwarfs anything a wrapper-level optimization could deliver.
What happens when an alternative enters the market
Until very recently, the costs documented above weren’t being priced into MicroStrategy’s stock in any visible way. The reason was structural: there was no alternative. MSTR was the only retail-accessible route to leveraged Bitcoin exposure inside conventional brokerage accounts. The wrapper costs — premium volatility, dilution timing risk, convertible-covenant exposure, the dependency on continued accretion via premium — were the unavoidable cost of admission to leveraged BTC. A holder choosing between MSTR and spot was choosing between leveraged BTC with the wrapper or no leverage at all. The wrapper costs went into the bundle priced without scrutiny.
That equilibrium changes the moment a comparable alternative becomes available. A holder choosing between MSTR and a protocol-native leveraged BTC product can now ask the question that wasn’t ask-able before: what am I paying for the wrapper, in addition to the leverage itself? Today’s 0.77× mNAV is one possible answer the market is giving. The 6.34× mNAV at the 2020 peak was a different answer in a different regime — the answer the market gives when the question can’t be asked.
What happens in the equilibrium where the question is ask-able by everyone? The premium converges toward the value of the differential the wrapper actually delivers. On the numbers above, that differential is meaningfully negative on a Sharpe basis. A wrapper that delivers 11pp more USD CAGR while raising volatility by 35pp and dropping Sharpe from 0.73 to 0.57 isn’t a free lunch; it’s a worse risk-adjusted trade than just holding Bitcoin, before any comparison to the protocol-native alternative even enters the picture. Once that comparison can be made — once buying leveraged BTC no longer requires the wrapper — the case for paying any premium for the corporate-treasury structure compresses meaningfully.
The 0.77× discount may be a leading indicator of that compression, not an endpoint.
Bitcoin treasury companies emerged because there was no other way to get leveraged Bitcoin exposure inside conventional brokerage accounts. They solved that access problem using the tools available — corporate balance sheets, capital-markets discipline, premium-funded issuance — and over a full cycle did empirically beat passive spot exposure. That credit is real and deserved.
But the access problem no longer requires the wrapper. BTC-Jr — with the underlying architecture detailed in the Durable Leverage paper — delivers the same first-order outcome without the wrapper-level volatility, premium-cycle risk, dilution events, convertible-covenant cycle, or implicit dependency on the market continuing to pay a premium for the corporate-treasury structure.
The substitution case
The strongest version of the architectural argument is not competitive but substitutive. The DAT model, as this article has characterized it, is now load-bearing on two dependencies: (1) a sustained mNAV premium that funds the original accretion flywheel, and (2) the cash-flow solvency of the STRX preferred-share stack built to substitute for the premium when it fades. The first dependency has already broken — mNAV has compressed into discount territory. The second is now exposed: STRX obligations persist regardless of BTC performance, and the workaround introduced its own insolvency-spiral risk that the original architecture didn’t carry. Both fragilities are properties of the wrapper, not the business.
A DAT that holds BTC-Jr in place of spot BTC ceases to depend on the premium at all. The protocol delivers the leverage the flywheel was funding. The premium-dependent accretion mechanism becomes unnecessary because a non-premium-dependent mechanism exists. Whether the market values the wrapper at 6× NAV or 0.7× NAV, the underlying treasury continues to grow BTC-per-share exposure at the rate the protocol delivers — independent of sentiment, premium-cycle timing, or the next round of convertible-debt issuance.
And the asymmetry runs in the other direction too. If and when a premium returns — when the market is willing again to pay above NAV for the wrapper structure — the substitution doesn’t disable the canonical flywheel; it amplifies it. Premium-funded equity issuance still buys at NAV, but the NAV being purchased is now leveraged 1.33× through the protocol. Every dollar of premium-funded deployment captures roughly 1.33× the per-share Bitcoin exposure that the same deployment would have captured through spot BTC. The flywheel becomes asymmetrically advantageous: when the premium works, it works harder; when the premium doesn’t work, the underlying leverage still delivers. The substitution preserves the upside mechanism — and amplifies it — while severing the downside dependency that has just cost MSTR holders the 65% drawdown from peak.
The substitution is operationally tractable: an existing DAT can convert a portion of spot BTC holdings into BTC-Jr, capture the 1.33× leveraged exposure mechanically, and scale back the convertible-issuance program. The resulting treasury also:
- Carries the leveraged Bitcoin exposure with a single position instead of an evolving capital structure
- Has a transparent and bounded financing cost — roughly (rf + 1%) / 3 per dollar of Jr equity — against the bundled wrapper cost (low convertible coupon + dilution events + refinancing risk + premium dependency + STRX solvency exposure) that funds the current stack
- Faces no debt covenants, no convertible-conversion dilution events, no refinancing window
The same logic extends to the broader corporate-wrapper leverage stack. The STRX preferred-share series — built to fund accumulation when the mNAV premium compressed — becomes structurally unnecessary in a treasury that holds BTC-Jr. Each dollar of BTC-Jr exposure delivers leverage at the protocol layer at roughly (rf + 1%) / 3 per dollar of Jr equity, against the 8–11.5% perpetual STRX dividend obligation it replaces. The substitution doesn’t just retire the spot/leverage trade-off — it retires the entire intra-wrapper leverage-funding stack (convertibles, premium-funded common issuance, STRX preferreds) as redundant workarounds for a problem that no longer exists at the treasury level.
The wind-down is largely self-financing. When the market recognizes that the wrapper-cost overhang is being retired — BTC-Jr delivers leverage at half the cost STRX charges, with no premium dependency and no rigid cash-flow obligations — mNAV likely re-expands. The accretive common-issuance lever that broke at 0.77× becomes viable again at the higher mNAV, and the DAT can use it to retire existing STRX at par. The mechanism the workarounds were built to replace becomes the mechanism that funds their retirement. The flywheel restarts on the wrapper’s original lever, now structurally cheaper to operate because the leverage primitive underneath it is denser and cleaner.
This is the architectural shift’s deeper read. The protocol is not only an alternative for holders deciding between MSTR and direct exposure. It’s a foundation on which the DAT itself could rebuild — preserving the brokerage-account access, jurisdictional, and tax-wrapper advantages that justified the structure in the first place, while shedding the wrapper-level costs and both architectural dependencies (the mNAV premium and the STRX cash-flow solvency requirement) that this article has documented. The competitive frame (“MSTR vs BTC-Jr for the holder’s dollar”) is the surface. The substitution frame (“MSTR built on BTC-Jr”) is what an architecture-aware DAT operator would consider once the option is available.
What survives the architectural shift
MicroStrategy’s experience refines the DAT contract. The wrapper offers real structural advantages — brokerage-account access, jurisdictional reach, tax treatment, allocator inclusion in mandates that exclude direct crypto exposure. Those advantages are durable and worth preserving. They are not what’s at risk.
What is at risk is the leverage primitive the wrapper has been using to deliver Bitcoin exposure: convertible debt and premium-funded ATM issuance, with all the wrapper-level costs documented above. That primitive has reached its operational limit at the 0.77× mNAV that breaks the accretion flywheel. The premium dependency, the STRX cash-flow solvency exposure, the convertible-cycle dilution, the wrapper-layer volatility, the Sharpe penalty, the institutional-inclusion friction — all of these are properties of the leverage primitive, not properties of the DAT business model.
The substitution case isn’t a displacement. It’s a preservation. Holding BTC-Jr in place of spot BTC at the treasury level keeps everything the wrapper does well — access, jurisdictional advantages, tax-wrapper benefits, equity-market liquidity — and replaces only the part of the stack that has reached its limit. The accretion flywheel becomes premium-independent. The 7pp annualized Sharpe-equivalent cost becomes recoverable. Institutional accessibility moves from marginal to comfortable. And when premium does return — in some regime it will — the same flywheel amplifies, because the leverage primitive underneath it is denser.
Bitcoin treasury companies were a real solution to a real problem, built with the best architecture available when the strategy started. The architecture has improved. The DAT business survives the improvement intact — preserving its structural advantages, shedding the leverage-primitive costs — by adopting the better primitive. The strategy that grew MicroStrategy’s BTC-per-share for five years, currently stalled at the mNAV that no longer supports it, does not end at this discount. It restarts on infrastructure that does not depend on the premium to function.
That is the available answer to how MicroStrategy becomes premium-independent.
Specific architectural details and the full-cycle empirical analysis are in the Durable Leverage paper (Fragments Research, 2026). A companion essay, Moderate Leverage Outperforms Every BTC Yield Product, covers the comparison with passive yield-product alternatives.
Data & methodology
Price data. Daily close prices for MSTR and BTC over Aug 2020 → Dec 2025, fetched via the yfinance package (Yahoo Finance historical data).
MSTR BTC holdings. Compiled from MicroStrategy’s 8-K disclosures of Bitcoin purchases, cross-referenced against bitbo.io’s MSTR holdings tracker and SaylorTracker.com. Holdings interpolated linearly between disclosed purchase events.
MSTR shares outstanding. Quarterly snapshots from MicroStrategy’s 10-Q filings (Q3 2020 through Q3 2025), with daily values linearly interpolated between quarter-ends.
mNAV ratio. Computed daily as (MSTR market cap) / (BTC holdings × BTC close price), using the inputs above.
Risk metrics. Sharpe, annualized vol, CAGR, and max drawdown all calculated from daily USD-denominated returns over the same Aug 2020 → Dec 2025 window. Annualized vol = daily vol × √252. Sharpe = (CAGR − rf) / annualized vol, with rf = 4%. Max drawdown measured against the rolling all-time-high.
Moderate 1.33× leverage line. Simulated using a constant-leverage daily-reset model with zero expense ratio and zero financing cost. This is a reference benchmark, not a product specification — BTC-Jr’s actual financing cost (≈ (rf + 1%) / 3 per dollar of Jr equity, documented in the Durable Leverage paper) represents a bounded drag against this idealized line.
Architectural specifications. BTC-Jr’s financing cost formula, perpetual-tranching mechanics, productive-band sizing for BTC (the basis for the ~1.3–1.5× optimal-leverage range), and the liquidation-free architecture all originate in the Durable Leverage paper (Fragments Research, 2026).
Institutional Sharpe thresholds. The ~0.5 minimum Sharpe figure cited in the institutional-sizing section is a rough heuristic drawn from manager-evaluation practice across allocators; specific minimums vary materially by allocator class, mandate, and asset category.