The Demand for Buy-and-Hold Leverage Is Already Visible — in LETF Holding Periods
LETF issuers explicitly recommend holding for one day or less. Tens of billions of dollars of LETF capital are held for weeks, months, even years instead. That mismatch is costly to the holders and diagnostic for the market — it is observable demand for buy-and-hold leverage that does not exist as a clean product. The size of the misalignment is the size of the suppressed market.
The argument. Daily-rebalance LETFs are explicitly designed for sub-1-day holding. The path-dependent mechanics make any longer horizon structurally hostile to buy-and-hold capital. And yet — a meaningful share of long LETF AUM is held for weeks, months, even years. That mismatch is dangerous for the holders, but it is also diagnostic for the market: it is observable, validated, present-day demand for a product the issuers of these instruments do not claim to deliver. The demand isn’t latent. It’s already in the market, paying real money for the wrong product.
The empirical answer, sized: $44 billion of long US LETF AUM is currently held past the two-week threshold, paying ~$1.3 billion per year in financing premiums for a product designed for daily horizons. Including the 1-2 week bucket pushes the misaligned AUM to $91 billion. These are observable dollars, in observable accounts, currently paying observable costs to hold instruments that were not architected for their actual holding behavior. The size of that misalignment is the floor on the addressable market for a buy-and-hold leverage primitive that delivers what these holders are reaching for.
The recommendation versus the reality
Every long leveraged ETF in the US market carries the same prospectus disclosure: intended for short-term holding, typically not more than one day. The language is not boilerplate filler — it reflects an accurate description of the product’s design constraint. Daily-rebalance LETFs reset leverage exposure at the close of every trading session. That mechanic guarantees the stated multiplier on a one-day horizon and almost guarantees deviation from the stated multiplier on any longer horizon. Issuers say so. The SEC’s investor bulletins say so. Academic literature has documented it for nearly two decades.
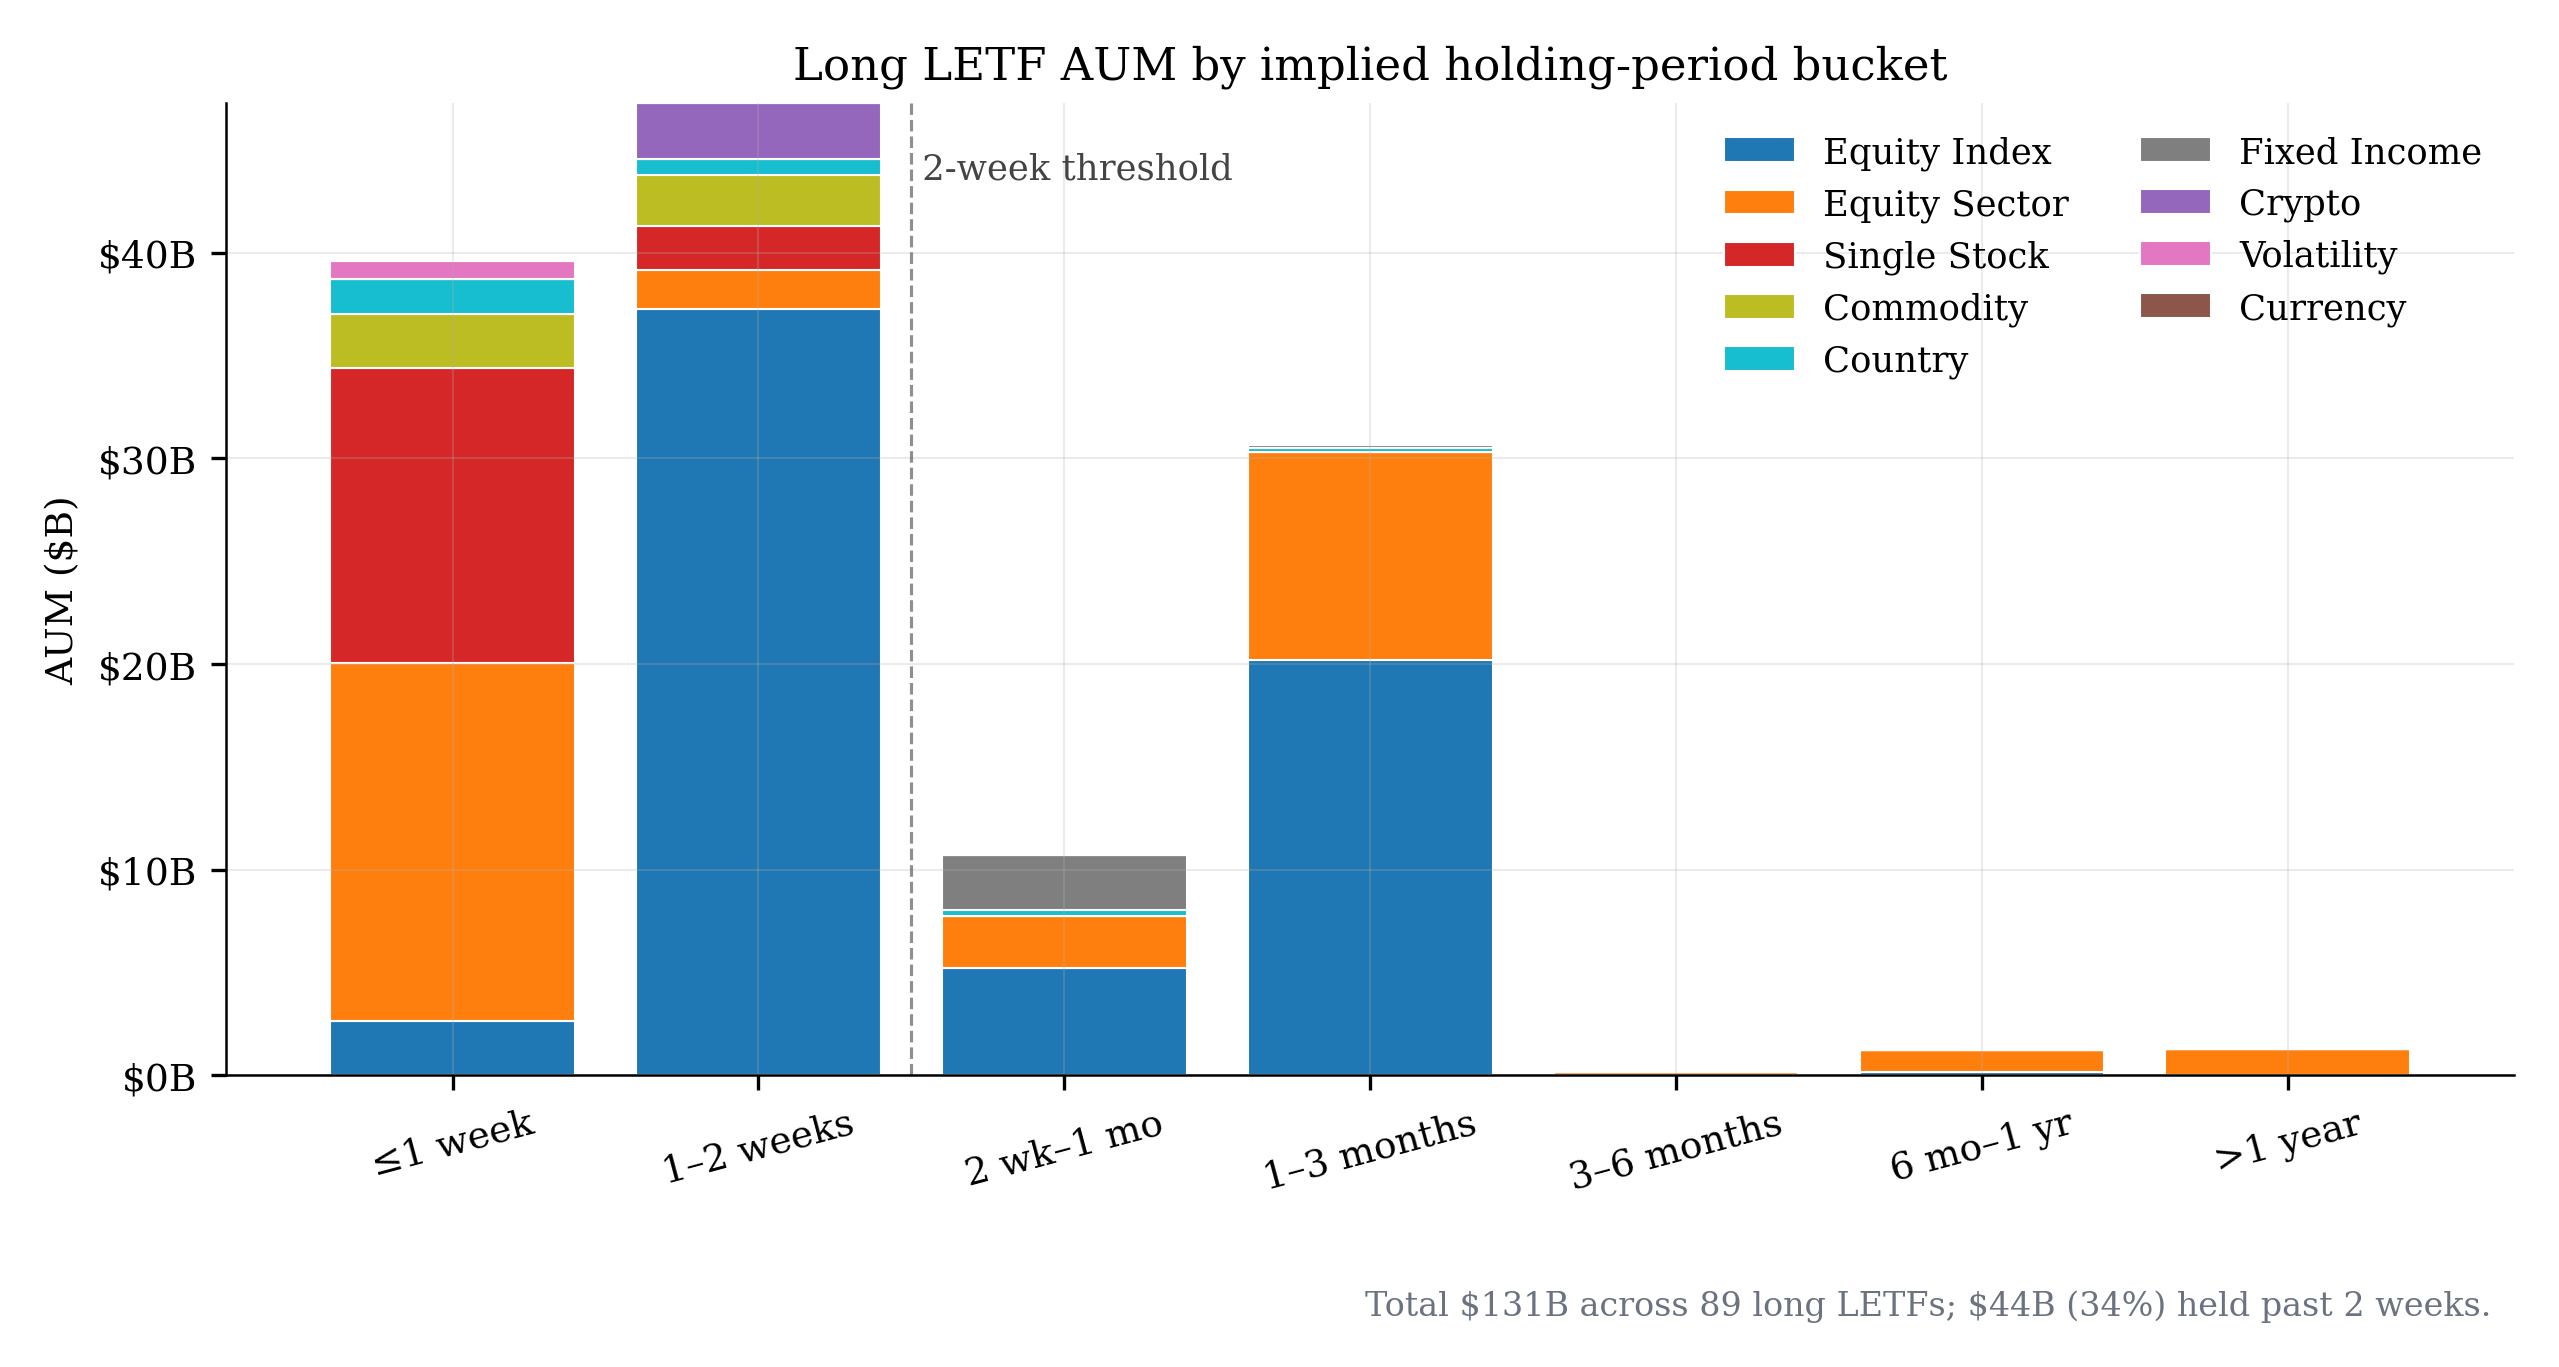
The reality of LETF holding behavior diverges sharply from the design intent. A snapshot of the long US LETF universe — 89 products with usable AUM and average-daily-volume data, totaling ~$131 billion in AUM — produces the following implied-holding-period distribution:
 |
|---|
| Long US LETF AUM by implied avg holding period, colored by asset class. Implied holding period = AUM ÷ average daily dollar volume (trading days). Buckets reflect the design boundary (≤1 day, recommended) ramping into structural misalignment (2+ weeks, well past the path-dependent break-even). $44B of the $131B total sits past the 2-week threshold; another $47B sits in the 1-2 week bucket where vol drag has already become material. |
Two things to notice immediately. First, ~30% of AUM sits in the 1-3 month bucket. These products are being held for entire calendar quarters in instruments architected for one-day exposure. Second, the absolute long tail — 3 months to 1 year and beyond — is small ($2-3B) but exists at all, which is itself remarkable. Issuers explicitly tell holders not to do this, and a non-trivial subset of holders does it anyway.
The implied-holding-period methodology has a limitation worth flagging: AUM ÷ daily dollar volume is a back-of-envelope industry standard, not a holding-period census. It captures average turnover but conflates intraday activity with overnight holding. Refined analysis using 13F institutional filings or FINRA brokerage data would tighten the estimates but is operationally harder; the broad picture would not change.
Why this is dangerous
Long-horizon holders of daily-rebalance LETFs are subject to six structural costs that the product disclosures warn about but do not quantify in a way most retail or even mid-tier institutional holders evaluate carefully:
-
Path-dependence (volatility drag). Daily rebalancing means realized cumulative returns diverge from N× the underlying’s cumulative return over any non-trivial horizon, even when the underlying ends flat. In volatile markets, the realized leverage is materially less than the stated leverage; the holder’s geometric mean return collapses against the underlying’s. A multi-week LETF holder in a sideways market loses money even though their thesis was right.
-
Financing-premium burn. Single-stock and other thin-underlying LETFs pay approximately 19% annualized financing premiums to swap counterparties — the dealer cost of warehousing the LETF’s rebalance flow. (For derivation, see the LETF Rebalancing Costs essay.) Held for a year, that’s a 19% tax on capital before any market move. Broad-index 2× products pay ~0.8% — much smaller but meaningfully larger than holders typically account for. At the LETF universe’s blended rate of ~5–6%, even moderate misalignment costs holders billions per year.
-
Tracking error compounds. Over weeks or months, the multiplier relationship fails dramatically. A 2× LETF may deliver 1.4× or 2.6× of the underlying return depending on the realized path, not the stated 2×. Holders making allocation decisions based on “I want 2× of this asset” are getting a stochastic multiplier in practice.
-
Gap risk in stress events. Overnight gaps amplify by leverage with no possibility of intra-event rebalance protection. Realized leverage can spike above stated levels in fast-moving sessions, and the holder learns about it after the fact.
-
Tax inefficiency. Daily rebalancing inside the fund generates short-term gain realizations passed through to holders as distributions. Long-horizon LETF holders are unwittingly choosing the least tax-efficient way to express leveraged exposure to a benchmark — typically worse than direct margin borrowing on the underlying, by a meaningful margin in high-bracket states.
-
Identity miscoding. Single-stock LETFs especially are culturally coded as degen-trader instruments. Holders trying to express multi-month leveraged conviction on a name end up using an instrument whose marketing, naming, and broker-platform positioning is calibrated for day-traders. The product design follows the cultural signal rather than the actual holder profile. This is not a financial cost but it is a real one — it pushes pragmatic buy-and-hold leverage capital into instruments and account types optimized for someone else.
The first three are the published academic and practitioner literature on LETF behavior — well-documented and, for the audience this essay is written for, not novel. The fourth and fifth get less attention but compound the others in practice. The sixth is structural and worth surfacing explicitly because it explains why the demand stays invisible at the marketing layer: holders aren’t asking for “responsible leverage” by that name; they’re hidden inside instruments coded for the opposite holder.
How big is the misalignment
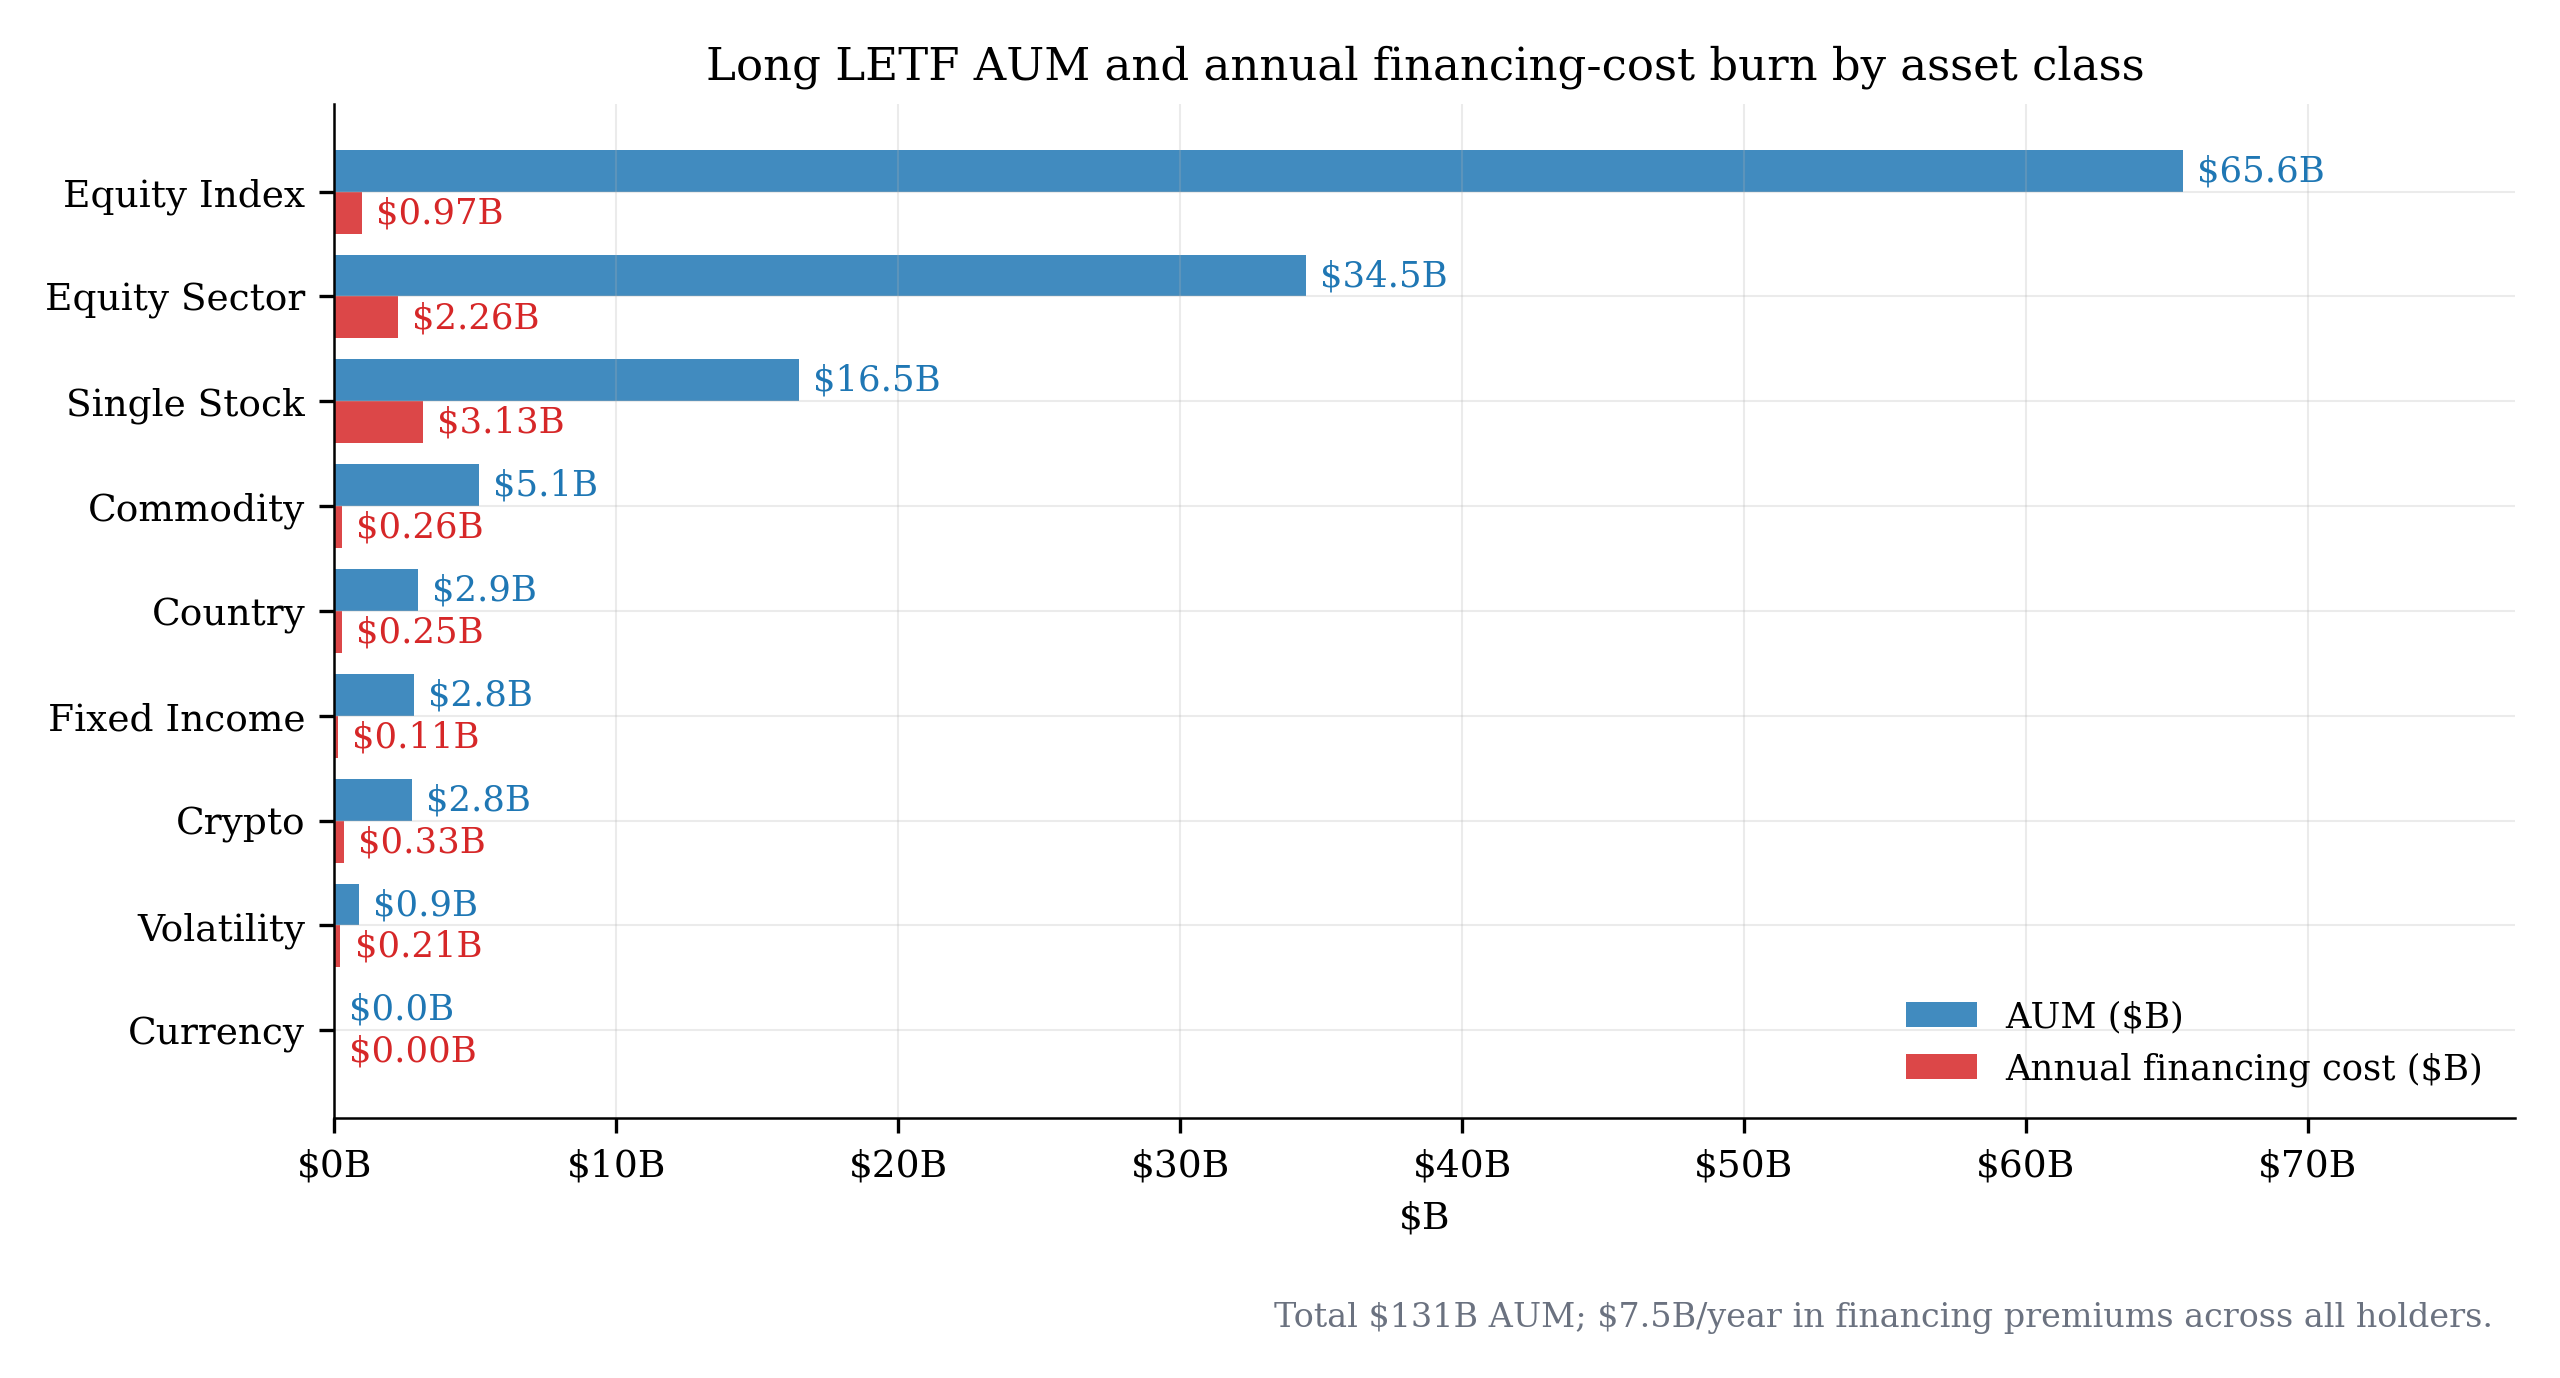
The 89-product universe (which covers essentially all long US LETFs ≥ 2× with usable data) breaks down as follows by asset class:
 |
|---|
| Aggregate AUM and annual financing-cost burn by asset class across the long US LETF universe. Equity Index dominates by AUM but is the cheapest per dollar. Single-stock LETFs carry small AUM but disproportionate cost burn — exactly the dealer-execution-factor concentration the LETF Rebalancing Costs essay derives from first principles. |
The aggregate numbers most directly relevant to the demand argument:
- Total long US LETF AUM: $131B (89 products)
- AUM held past the 2-week threshold: $44B (34% of total)
- AUM held past the 1-week threshold: $91B (70% of total)
- Annual financing-cost burn from long-duration holders (>2 weeks): ~$1.3B
- Total annual financing-cost burn across all holders: ~$7.5B
Equity Index is the largest category by AUM ($65.6B) but the cheapest per dollar (~$0.97B/yr cost burn) because broad-index swap markets are deep and dealers can hedge at low cost. Single Stock is a much smaller category by AUM ($16.5B) but carries $3.13B per year of cost — concentrated in flagship products (TSLL, NVDL, MSTU, CONL, etc.) where the dealer-execution-factor argument from the LETF Rebalancing Costs essay applies at full force.
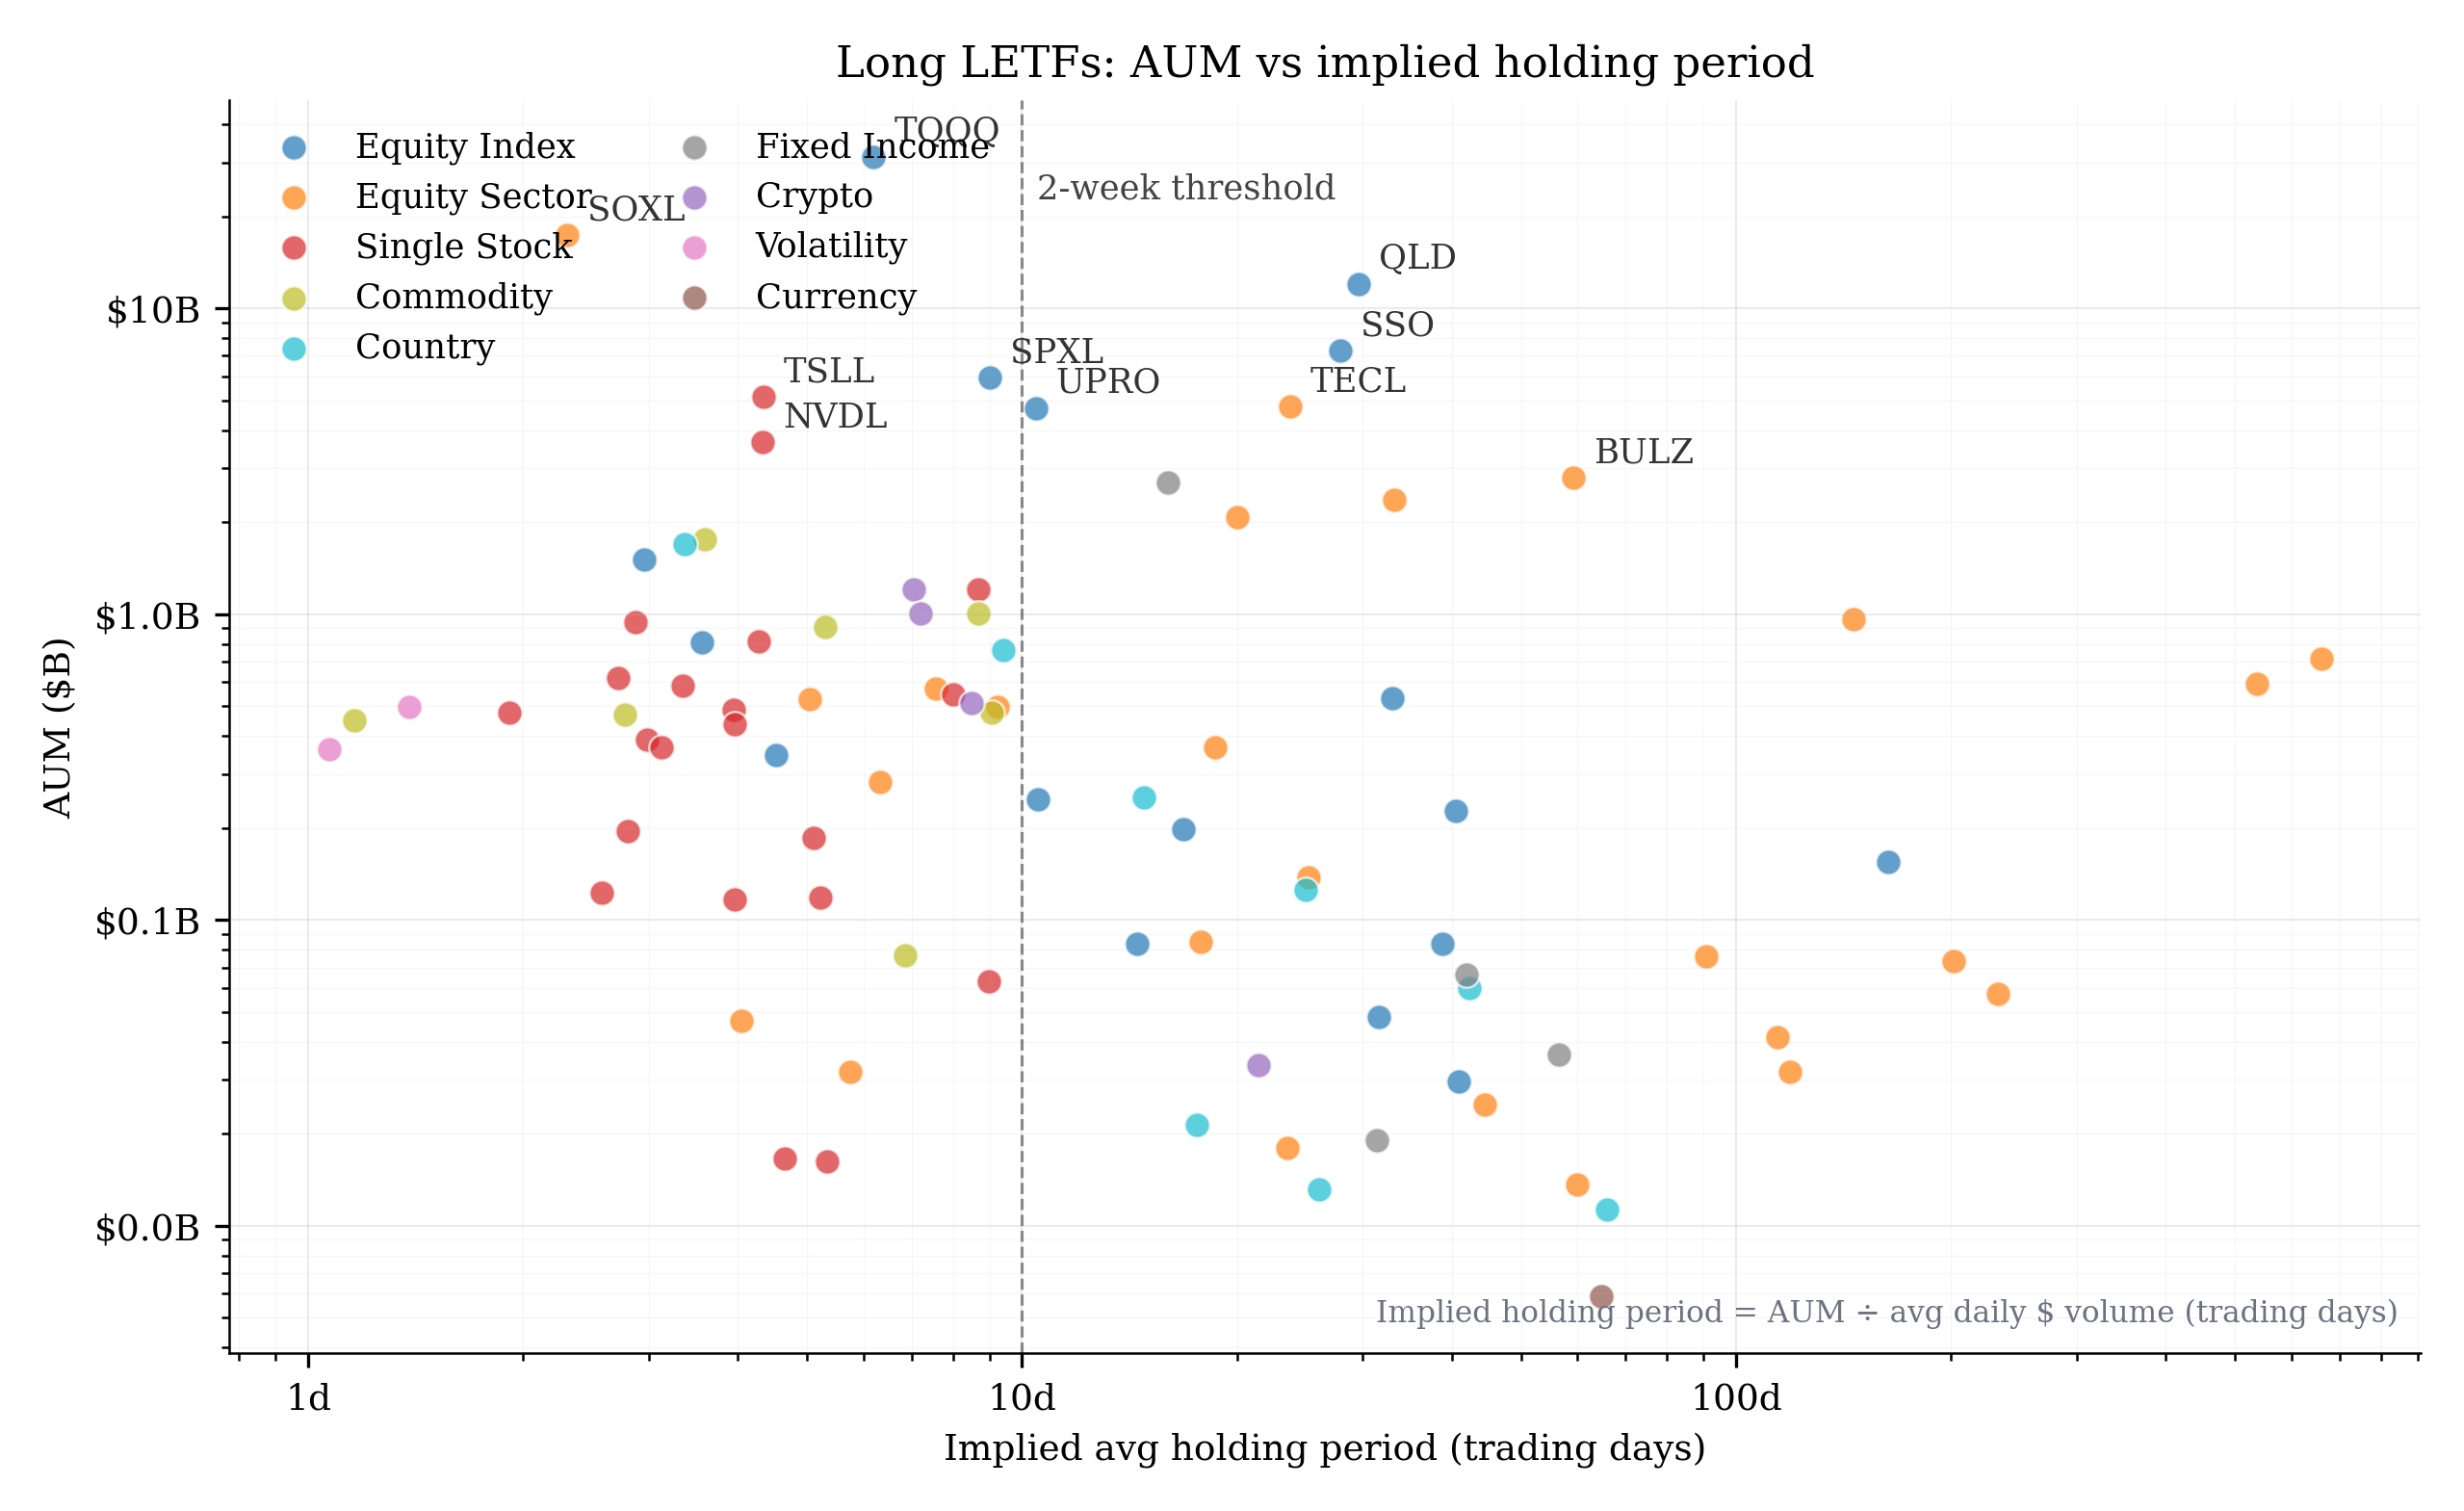
A scatter view of individual products clarifies how the misalignment distributes across the universe:
 |
|---|
| Long US LETFs plotted by AUM versus implied avg holding period. Products to the right of the 2-week threshold are being held meaningfully past the design intent. QLD (2× QQQ) at ~30 days, SSO (2× SPY) at ~28 days, TECL (3× tech) at ~24 days, BULZ (3× FANG+) at ~59 days are notable: flagship leveraged products held for entire calendar quarters in daily-rebalance instruments. |
A few case studies stand out:
-
QLD (2× QQQ) — $12B AUM, ~30-day implied holding period. Two-times Nasdaq-100 held on average for a month. The holders are clearly buy-and-hold capital expressing Nasdaq conviction at 2× — that is, conviction with appropriately moderate leverage on a positive-drift index. They are doing exactly the right strategic thing through structurally the wrong instrument.
-
SSO (2× SPY) — $7.3B AUM, ~28 days. Identical pattern on broad equity. The holder is making a buy-and-hold leveraged S&P 500 bet; the daily-rebalance vehicle is wrong for the horizon.
-
TECL (3× XLK) — $4.8B AUM, ~24 days. Three-times tech sector held for nearly a month. The leverage is more aggressive but the same misalignment is present.
-
BULZ (3× FANG+ Innovation) — $2.8B AUM, ~59 days. A 3× ETF held for almost two months on average. The compounded volatility drag in a 3× product over a 2-month horizon is severe; this is the most stark example of the misalignment in the data.
-
Single-stock concentration — TSLL ($5.1B), NVDL ($3.7B), MSTU ($0.7B) and the broader single-stock cohort show shorter implied holding periods (3-5 days) but at single-stock financing premium levels (~19%). Even sub-week holding periods burn 19% × holding_period_fraction = several percent on capital that the holder thinks is paying only the expense ratio.
A pattern in the case studies deserves direct examination: single-stock LETFs show much shorter holding periods than index LETFs, despite the underlying use cases being more conviction-oriented. A reader might expect single-stock LETFs — TSLL on Tesla, NVDL on Nvidia, MSTU on Strategy — to show the longest holding behavior, since the underlying use case is conviction-based leveraged exposure to specific names. Instead the opposite is true: single-stock LETFs show some of the shortest implied holding periods in the universe (3-5 days), while broad-index LETFs (QLD, SSO, UPRO, TECL) show weeks to months.
The explanation is in the cost structure, not in holder preference. Index underlyings have deep derivatives markets — S&P futures, sector ETFs, OTC index swaps — that dealer banks already hold inventory against as part of their broader market-making activities. Providing a 2× swap to an index LETF issuer is cheap because the dealer can net it against existing book exposure. The resulting financing premium is small (~0.8% for 2× broad index), and holding for weeks or months is tolerable even if not ideal. Single-stock underlyings have nothing comparable. Dealer banks must actually source the hedge for each single-stock LETF swap, and the cost of doing so drives the ~19% annualized financing premium documented in the LETF Rebalancing Costs essay.
The behavioral consequence: single-stock LETF holders want to hold for conviction horizons but the financing burn becomes intolerable within weeks; they exit, and the cohort that remains is the short-window subset that tolerates 19% drag for a few days. The visible $16.5B in single-stock LETF AUM is not the size of single-stock leveraged buy-and-hold demand. It is what’s left after a 19% financing tax has filtered the holder base down to short-window participants. A capital-efficient single-stock leverage primitive — delivered at index-LETF cost levels rather than single-stock-LETF cost levels — would likely capture a multiple of the visible AUM, drawn from holders who would prefer to hold TSLA, NVDA, MSTR, COIN, PLTR and similar names with leverage for months to years but currently cannot afford to.
The pattern: across asset classes, leverage levels, and underlying types, a significant share of LETF AUM is held materially longer than the design intent. The capital is trying to buy buy-and-hold leverage. The product they are using does not deliver that — and the dispersion of holding periods across categories is itself diagnostic, with cheaper-to-finance categories showing the longer behavior holders would express across the board if cost weren’t gating it.
What the cost burn is
Applying category-level financing-premium estimates to the AUM-by-bucket distribution produces the dollar-magnitude estimate of the misalignment cost:
- Long-duration holders (>2 weeks): ~$1.3B per year paid in financing premiums on capital that would prefer not to be paying daily-rebalance costs.
- Including 1-2 week holders: $3.0B+ per year. Even a one-week hold incurs material vol-drag and financing burn at the 2-3× leverage levels these products operate at.
- Total long LETF financing burn (all holders): ~$7.5B per year. Most of that is from short-window holders for whom the daily-rebalance is, arguably, the right product. The misalignment subset is the $1.3-3B/year that is observable, sized, and structurally addressable.
A useful comparison: the global LETF industry expense-ratio revenue is roughly $1-2B/year (assuming ~1% blended expense ratios on $131B AUM). The financing-premium cost paid by long-duration holders alone is comparable to or larger than the entire visible fee revenue of the LETF industry. The fees are not the cost; the financing premium is the cost.
This is the LETF Rebalancing Costs essay’s argument validated empirically and sized. The dealer-priced swap premium is not a theoretical financing burden — it is being paid right now, in real dollars, by tens of billions of long-duration AUM that is in the wrong product.
What the demand actually wants
Reverse-engineering the demand the LETF holders are reaching for produces a clean specification:
- Moderate leverage: 1.3× to 2× on positive-drift underlyings, occasionally 3× on the highest-conviction names
- Buy-and-hold horizon: weeks to months to years, not intraday
- Bounded financing cost: the holder is willing to pay some cost for the leverage but not 19% annualized; ideally a transparent, low-single-digit percentage that scales with leverage rather than with dealer execution capacity
- No daily-rebalance friction: the realized multiplier on cumulative returns should be close to the stated multiplier across any holding horizon
- No liquidation risk at moderate leverage levels: holders are buying conviction-sized exposure, not gambling on day-to-day price action
That specification is exactly what 2factor’s perpetual-tranching architecture is engineered to deliver. BTC-Jr is the existence-proof at 1.33× on Bitcoin: bounded financing cost (roughly (rf + 1%) / 3 per dollar of Jr equity), no daily-rebalance friction, no liquidation. The architecture generalizes across asset classes — the same productive-band approach that makes BTC-Jr work at 1.33× would apply to leveraged equity index exposure, sector exposure, and (with appropriate sizing) single-stock exposure on the highest-conviction names.
The $44B sitting in long-duration LETF positions today is exactly the holder population this architecture serves. They are already making the bet. They are already paying for the leverage. They are using the wrong instrument because the right instrument did not exist as a publicly accessible product at the moment they made the allocation decision.
Beyond the observable floor
The $44B observable in misaligned LETF holdings is a floor on demand for buy-and-hold leverage, not the total. Most of the population that wants leveraged buy-and-hold exposure does not show up in LETF data at all — they have looked at the product, recognized the mismatch with their horizon, and made some other choice. That other choice is almost always itself a workaround for the missing primitive.
The most direct adjacent pools:
-
Margin debt. FINRA-reported US securities margin debt sits around $800B. A meaningful share — plausibly tens of billions to low hundreds of billions — is being deployed by long-horizon investors using margin to express buy-and-hold leveraged equity convictions because LETFs cannot serve that purpose. These holders are paying margin interest (currently ~5–9%) for the same exposure the LETF cohort is paying financing premiums for.
-
Bitcoin treasury companies and adjacent corporate wrappers. MicroStrategy’s BTC stack alone sits at several tens of billions of dollars at current prices, funded through convertible debt, premium-funded common issuance, and the STRX preferred series. The broader Bitcoin treasury category includes the next wave of announced DAT entrants. Each dollar of DAT capital is structurally a buy-and-hold leveraged-Bitcoin position delivered through a corporate wrapper. The MSTR substitution case (detail) decomposes one element of this same demand pool.
-
BTC yield products. Approximately $10–15B in covered-call vaults, basis-trade products, and lending-based BTC yield strategies — capital that holds BTC, wants more BTC, and tries to manufacture additional accumulation through derivative or carry strategies because direct leverage on a positive-drift asset is unavailable. The companion yield-products essay decomposes this pool.
-
Single-stock leveraged demand suppressed by cost, not preference. As established in the previous section, the visible $16.5B in single-stock LETF AUM is a residual after the 19% financing premium filters the cohort to short-window holders willing to absorb the drag for a few days. The latent demand — conviction-based leveraged single-stock holders who would extend to weeks-to-months horizons given a clean cost structure — is plausibly a multiple of the visible figure. Holders of TSLL, NVDL, MSTU, CONL, PLTU and the broader single-stock cohort are precisely the population the architecture would serve, and the existing products under-serve them directly by pricing them out of the holding horizons their convictions imply.
-
Allocator capital with unfilled risk budget for moderate leverage. The largest pool, hardest to size precisely. Pensions, endowments, sovereign-wealth funds, and family offices construct allocations on risk-budget basis; for these allocators, moderate leverage on positive-drift assets has been a portfolio-theory standard for half a century but has been excluded as a category because no instrument made it available without daily-rebalance friction, wrapper-layer drag, or counterparty-credit exposure. Even 0.5–1% allocation across the ~$40T of US equity-investable household and institutional assets implies $200–400B in addressable demand at the institutional layer alone.
Stacking the visible against the adjacent: the $44B observable floor in LETFs likely understates the true addressable demand by an order of magnitude. The plausible total addressable market for a correctly architected buy-and-hold leverage primitive is, in approximate magnitude, $100B–500B, with the visible LETF floor at the lower bound and institutional allocator adoption at the upper bound. The precise number is uncertain; the order of magnitude is not. This is a primary market, not a niche.
Cross-asset implications
The analysis was run on the long US LETF universe specifically, but the structural pattern likely repeats wherever positive-drift assets have daily-rebalance leveraged products:
- Equity sector LETFs ($34.5B AUM): same pattern as broad index — moderate-leverage buy-and-hold capital using daily-rebalance instruments. The holder of a tech-sector LETF for two months is making a directional sector bet, not a day-trade.
- Commodity LETFs ($5.1B): gold, oil, natural gas. Implied holding periods skew shorter (commodity LETFs are more aggressively traded), but the same misalignment exists at the margin.
- Fixed income LETFs ($2.8B): primarily long-duration Treasury 3× products (TMF). Long-duration Treasury exposure at 3× held for any horizon longer than days produces severe path-dependence; this is a niche category but a particularly stark example.
- Crypto LETFs ($2.8B): 2× BTC and ETH products. Direct analog of the BTC-Jr opportunity but currently delivered through daily-rebalance vehicles with material premiums.
- Volatility LETFs ($0.9B): 2× VIX futures products. Path-dependence is so severe in volatility LETFs that any holding past a day is empirically destructive, but $900M sits in them anyway.
The cross-asset generalization is the most important downstream implication for product strategy: the addressable market for buy-and-hold moderate leverage is not BTC-specific or even equity-specific. It is wherever positive-drift assets exist and daily-rebalance leveraged products have been deployed as the only accessible alternative.
A coarse upper-bound estimate: aggregate global leveraged exposure across all daily-rebalance products (US LETFs, European leveraged ETPs, Asian listed leveraged funds) is on the order of $250-300B. Applying the same ~30% long-duration share to that broader universe implies $75-90B of long-horizon AUM sitting in daily-rebalance vehicles globally, paying multi-billion annual financing premiums for misaligned products. That is the global floor on addressable demand for the architecture.
What this measures
The point of this analysis is not to argue that LETF design is bad. LETF design is appropriate for the use case the issuers describe: intraday to sub-1-day directional exposure with stated leverage. For that holder, the product works.
The point is that a meaningful share of the capital using LETFs is not that holder. The capital is using the daily-rebalance product because no buy-and-hold leverage product existed when the allocation decision was made. The cost of that mismatch is observable, in published data, in real dollars. The size of the mismatch is the size of the suppressed market for a properly architected buy-and-hold leverage instrument.
Three observations close the analysis:
The demand is sized and observable. Forty-four billion dollars is not a marketing-deck TAM number. It is the AUM that is currently sitting in misaligned instruments, observable in published ETF data, paying observable financing premiums to dealer counterparties. The demand-inference uncertainty that ordinarily makes new-category sizing difficult does not apply here — the holders have already made the allocation decision.
The cost paid is the lower bound on willingness to pay. Long-duration LETF holders are paying ~$1.3B per year in financing premiums plus tax inefficiencies plus vol drag. That is what they are willing to pay for buy-and-hold leverage, currently, with the wrong instrument. A correctly architected instrument that delivered the same exposure at lower cost would capture this demand at price points well below the current burn.
The misalignment is architectural, not behavioral. The holders are not making mistakes. They are correctly identifying that moderate leverage on positive-drift assets is the right strategic position; they are using the only widely accessible vehicle that exists; and they are absorbing the structural costs that vehicle imposes because the alternative — un-leveraged exposure — under-deploys their conviction. The architectural fix is what unlocks this capital, not investor education.
The demand has been here all along. It has been hiding in product categories whose marketing and design point at a different holder than the one actually using them. The LETF holding-period data simply makes it legible.
Specific dealer-execution-factor decomposition behind the financing-premium estimates is in the LETF Rebalancing Costs essay. The architectural details of the buy-and-hold leverage primitive (perpetual tranching, productive bands, bounded financing) are in the Durable Leverage paper (Fragments Research, 2026). Companion essays in the demand-source series: Moderate Leverage Outperforms Every BTC Yield Product (BTC yield demand) and How MicroStrategy Becomes Premium-Independent (DAT demand).
Data & methodology
LETF universe. Seed list of 95 long US-listed leveraged ETFs with ≥2× stated multiplier, drawn from ProShares, Direxion, GraniteShares, T-Rex, Defiance, MicroSectors, and Volatility Shares issuer programs. Coverage spans broad equity index (S&P 500, Nasdaq-100, Dow, Russell 2000, mid-cap, EAFE, EM), equity sector (technology, semiconductors, financials, energy, healthcare, real estate, utilities, biotech, regional banks, defense, retail, cloud), country (China, Japan, Korea, Brazil, India, Mexico), commodity (gold, gold miners, silver, oil, natural gas), fixed income (long-duration Treasuries, 7-10 year), crypto (BTC, ETH), single-stock (AAPL, AMZN, GOOGL, MSFT, NVDA, TSLA, META, BABA, COIN, PLTR, JPM, AVGO, UBER, AMD, MSTR), and volatility (VIX futures). 89 of 95 returned usable AUM and average-daily-volume data through yfinance; 6 had data-quality issues and were excluded.
AUM source. yfinance Ticker.info.totalAssets field, retrieved June 3, 2026. Reflects fund-issuer-disclosed total assets at most recent reporting.
Average daily dollar volume. Trailing 90 calendar-day mean of (Close × Volume) from yfinance history data, retrieved same date.
Implied avg holding period. AUM ÷ avg daily dollar volume, in trading days. Industry-standard back-of-envelope methodology. Limitations: conflates intraday turnover with overnight holding; assumes uniform turnover across the holder base (which understates both the short-tail and long-tail of the actual distribution); does not distinguish institutional from retail. Refined analysis using 13F filings or FINRA brokerage-level data would tighten the per-product estimates but would not materially change the aggregate picture.
Holding-period buckets. ≤1 week (0–5 trading days), 1–2 weeks (5–10), 2 weeks–1 month (10–21), 1–3 months (21–63), 3–6 months (63–126), 6 months–1 year (126–252), >1 year (252+). Thresholds chosen to reflect (a) the issuer’s design intent (≤1 day, with ≤1 week as a reasonable practical bound), (b) the academic literature on when LETF path-dependence becomes material (typically 1–2 weeks), and (c) round-number calendar boundaries thereafter.
Financing premium estimates. Category-level annualized swap-spread financing premiums applied per (asset class, leverage multiplier):
- Single Stock 2×: 19% / 3×: 28%
- Equity Sector 2×: 4% / 3×: 7%
- Equity Index 2×: 0.8% / 3×: 1.8%
- Country 2×: 6% / 3×: 9%
- Commodity 2×: 5% / 3×: 8%
- Fixed Income 2×: 2% / 3×: 4%
- Crypto 2×: 12% / 3×: 18%
- Volatility 2×: 25% / 3×: 35%
- Currency 2×: 3%
Derivation and supporting analysis for these category-level premia are in the LETF Rebalancing Costs essay. The single-stock 2× figure (~19%) is the empirically observed financing premium documented in that essay’s central case study; other category estimates are conservative midpoints calibrated to the same dealer-execution-factor framework with category-appropriate market-depth parameters.
Annual cost burn. AUM × financing premium, per product. Aggregated by bucket and by asset class.
Sample completeness and caveats. The universe excludes short/inverse LETFs (out of scope — different holder profile), Europe-listed leveraged ETPs, Asia-listed leveraged funds, and OTC structured products with similar payoff structures. The 89-product US universe captures the vast majority of US-listed long leveraged ETF AUM as of the data collection date. AUM is a point-in-time snapshot; financing premiums are estimates calibrated to recent market conditions and would shift with credit-spread cycles. The headline conclusions are robust to ±30% variation in either input.
Reproducibility. Analysis scripts at experiments/exp_letf_holding_period.py and experiments/exp_letf_holding_period_figures.py in the Durable Leverage research repository. Per-product results table at data/letf_holding_period.csv.