The Demand for Buy-and-Hold Leverage Is Already Visible — in Perp Capital Distribution
Perp futures markets are publicly associated with extreme leverage — 50× and 100× retail speculation, headline-grabbing liquidations, the cultural register of crypto-Twitter degeneracy. Narrow the lens to capital that is actually running long-leveraged exposure on Hyperliquid, and the picture changes. The majority of that capital — 58% — sits at modest leverage (≤3×), concentrated in the whale and pro cohorts that resemble institutional allocators more than degens. These holders are using perps as a buy-and-hold leverage primitive and paying ~11% annualized funding for exposure that a properly architected protocol-native product would deliver at a fraction of the cost.
The argument. The conventional read on perp futures is that they serve high-leverage short-horizon speculators. The capital-weighted distribution complicates that reading. On Hyperliquid — the largest fully on-chain perp venue and the only one with per-position data publicly observable — restrict the lens to accounts actually running long-leveraged exposure (notional ≥ equity, i.e. L ≥ 1×), and 58% of that capital sits at ≤3× leverage. The majority of leveraged buy-and-hold capital is held at modest leverage. That capital is paying perp funding (~11% annualized on notional, blended across exchanges) for exposure they would unambiguously be better served holding through 2factor’s perpetual-tranching architecture at a structurally lower cost. The misalignment isn’t that perps don’t serve buy-and-hold leverage demand. It’s that perps are the de facto buy-and-hold leverage product for a meaningful share of crypto-native capital, and they’re charging far too much for that service.
The empirical answer, sized: among Hyperliquid’s leveraged long deployers, ~$186M in equity supports ~$759M in long notional. The modest-leverage subset (≤3×) holds ~$107M in equity against ~$182M in notional. At a blended ~11% annualized perp funding rate, that’s roughly $20M/year in funding cost paid by Hyperliquid’s modest-leverage cohort alone — for exposure BTC-Jr would deliver for ~$5M. Extrapolated against $60–80B in global perp open interest, the implied modest-leverage cohort is paying multiple billions per year to maintain leveraged buy-and-hold exposure through the wrong product.
The perception versus the reality
The popular reading of perp markets — repeated across crypto media, advisor education materials, and traditional finance commentary — is that perps are a casino for high-leverage degens. The data supports that reading if you weight by notional or by position count, since thousands of high-leverage positions on small accounts dominate those measures. But notional and position counts answer the wrong question. The right question is: where is the capital that’s actually using leverage?
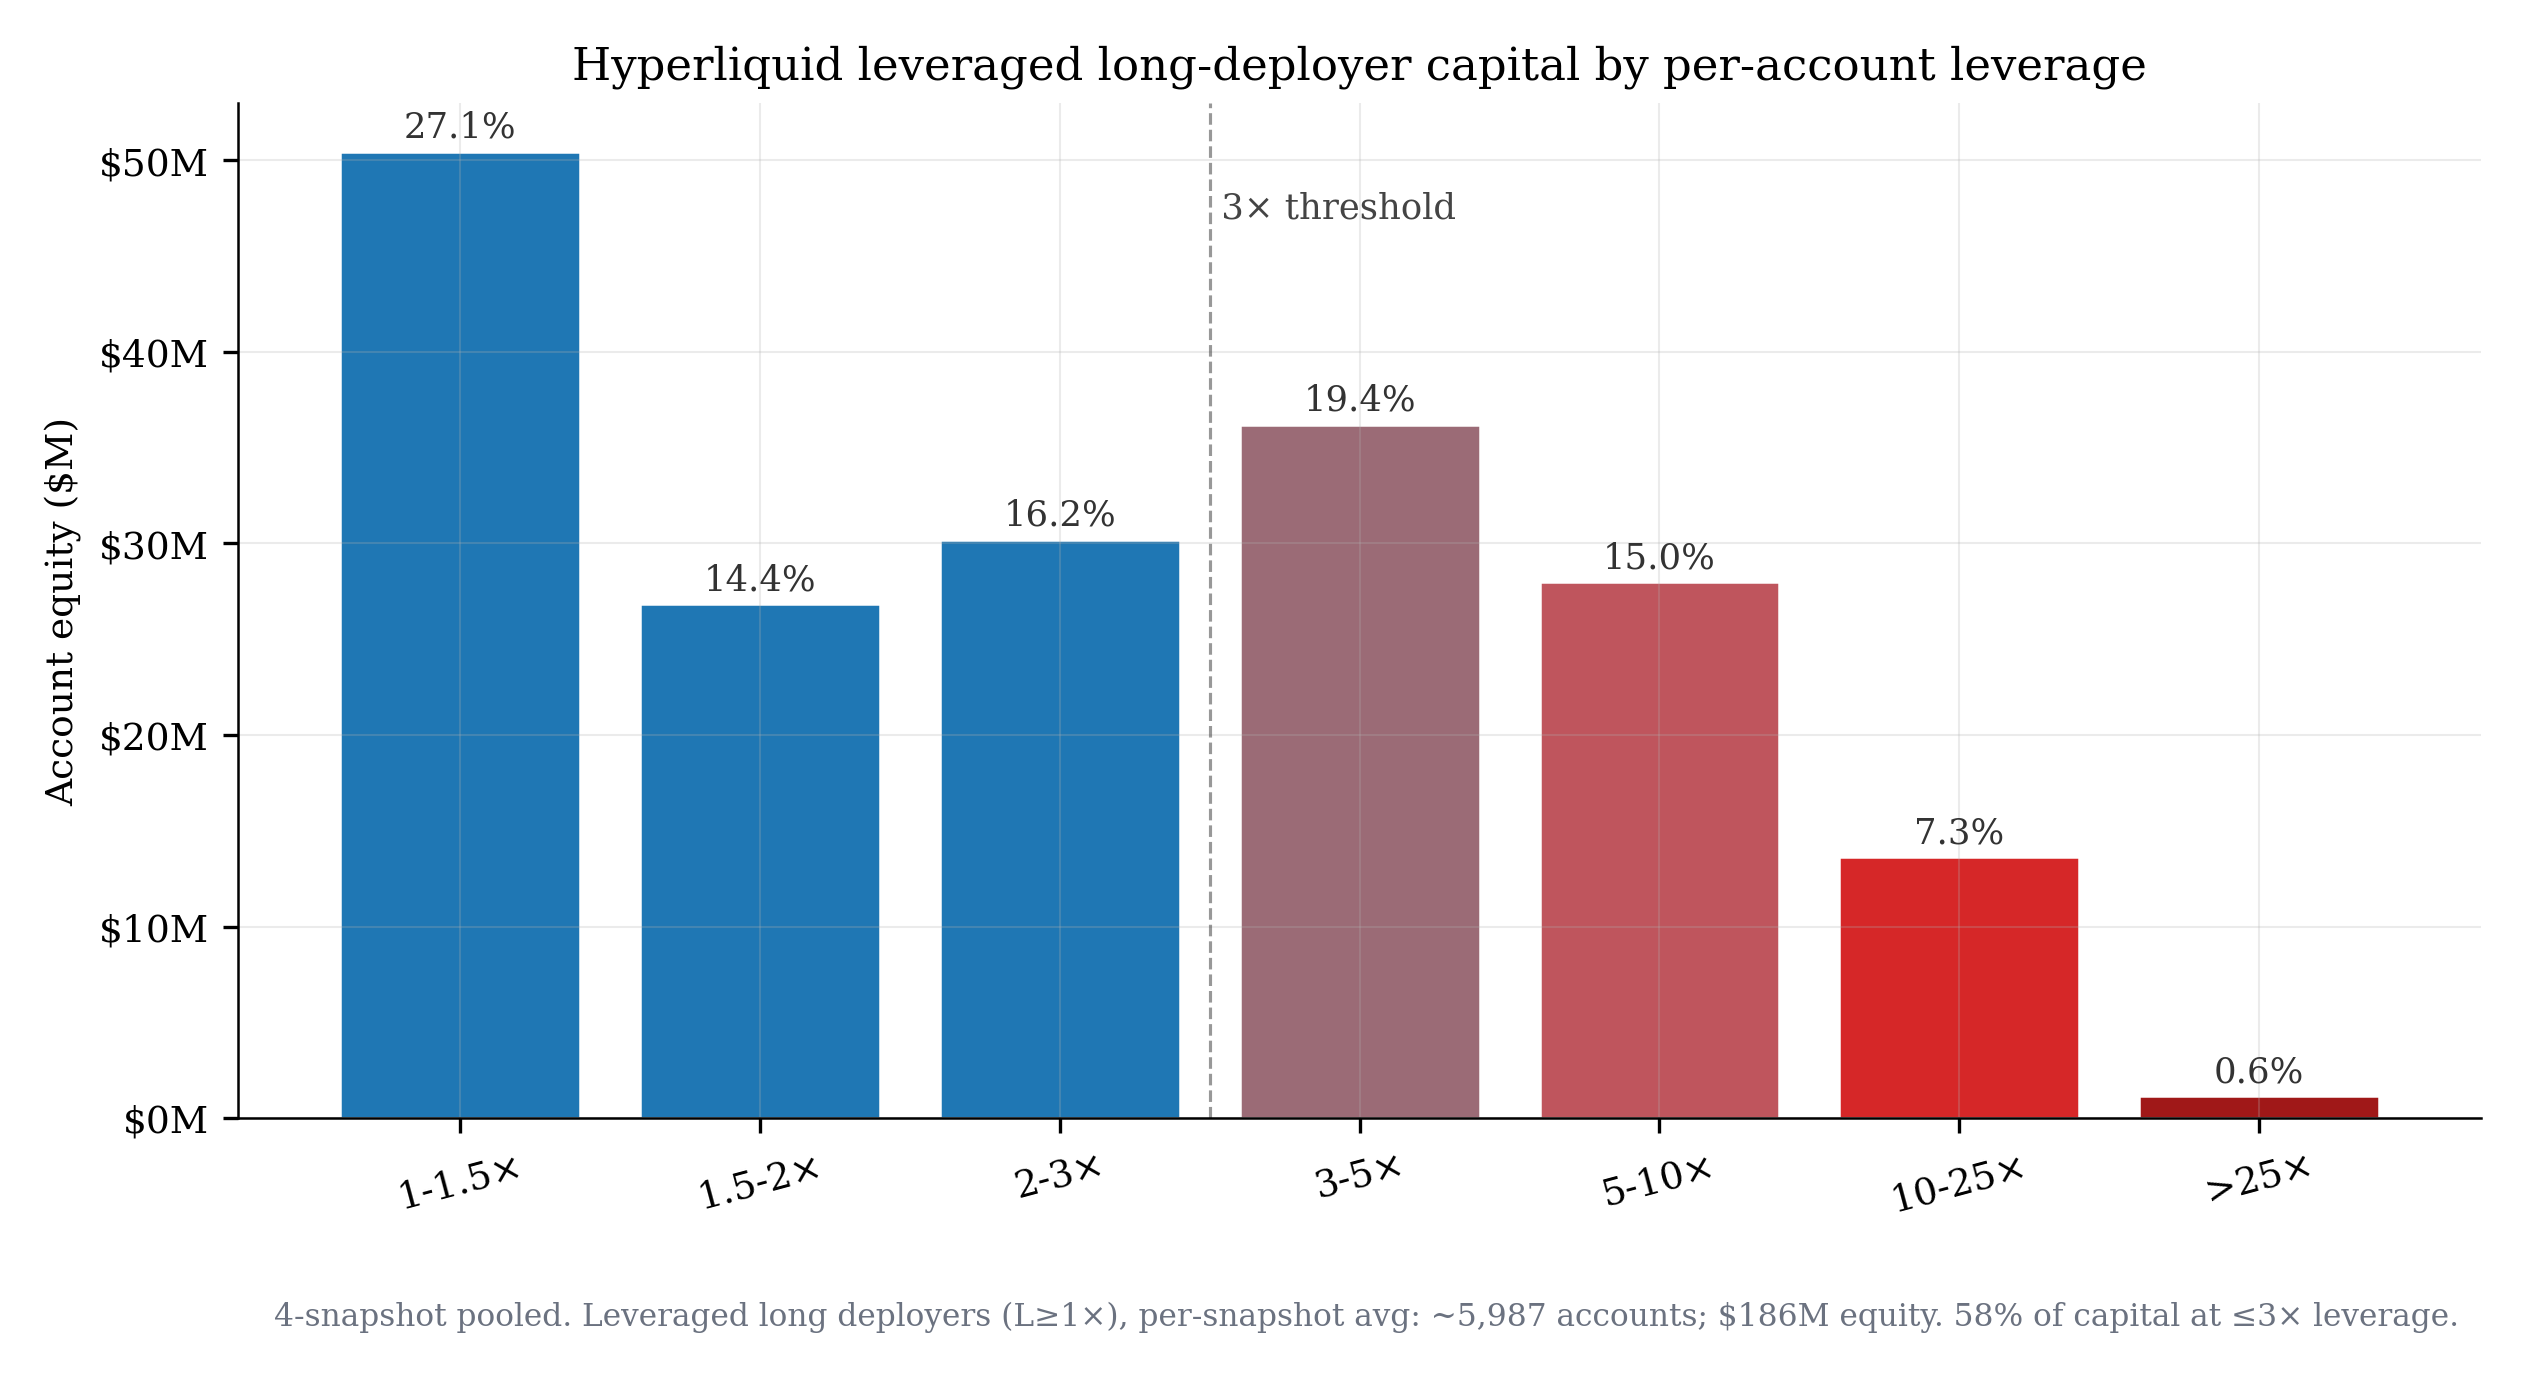
The 2factor research dashboard at data.2factor.finance/perp-leverage-distribution pulls per-account state across 64,863 Hyperliquid accounts (4-snapshot pooled methodology, Oct 2025 – June 2026), reconstructing leverage as account notional divided by account equity. A first observation: of the 13,347 long-deployer focus accounts, fewer than half are actually leveraged (long notional ≥ equity). Most long-deployer accounts hold more equity than long notional — they are cash-heavy with a directional tilt rather than running leverage. The leveraged subset — accounts with L ≥ 1× — holds $186M in equity and $759M in long notional. The leverage distribution across that equity:
 |
|---|
| Hyperliquid leveraged long-deployer capital by per-account leverage, 4-snapshot pooled methodology, filtered to accounts with L ≥ 1×. 58% of leveraged-cohort equity sits at ≤3× leverage; the 1–1.5× bucket alone holds 27% of leveraged capital. The dominant leveraged posture is modest, not extreme — the high-leverage cohort (>10×) holds 8% of leveraged equity but generates 32% of notional and the bulk of the funding-cost burden. |
Two things follow immediately. First, the dominant leveraged posture is modest. 27% of leveraged capital sits at 1–1.5× — these are accounts running essentially spot-equivalent exposure plus a small slice. 58% sits at ≤3×. This is buy-and-hold leverage behavior, not speculative behavior. Second, the high-leverage cohort (>10×) — the cultural archetype of perp users — holds 8% of leveraged equity but generates 32% of leveraged notional. That cohort dominates the headline but not the capital.
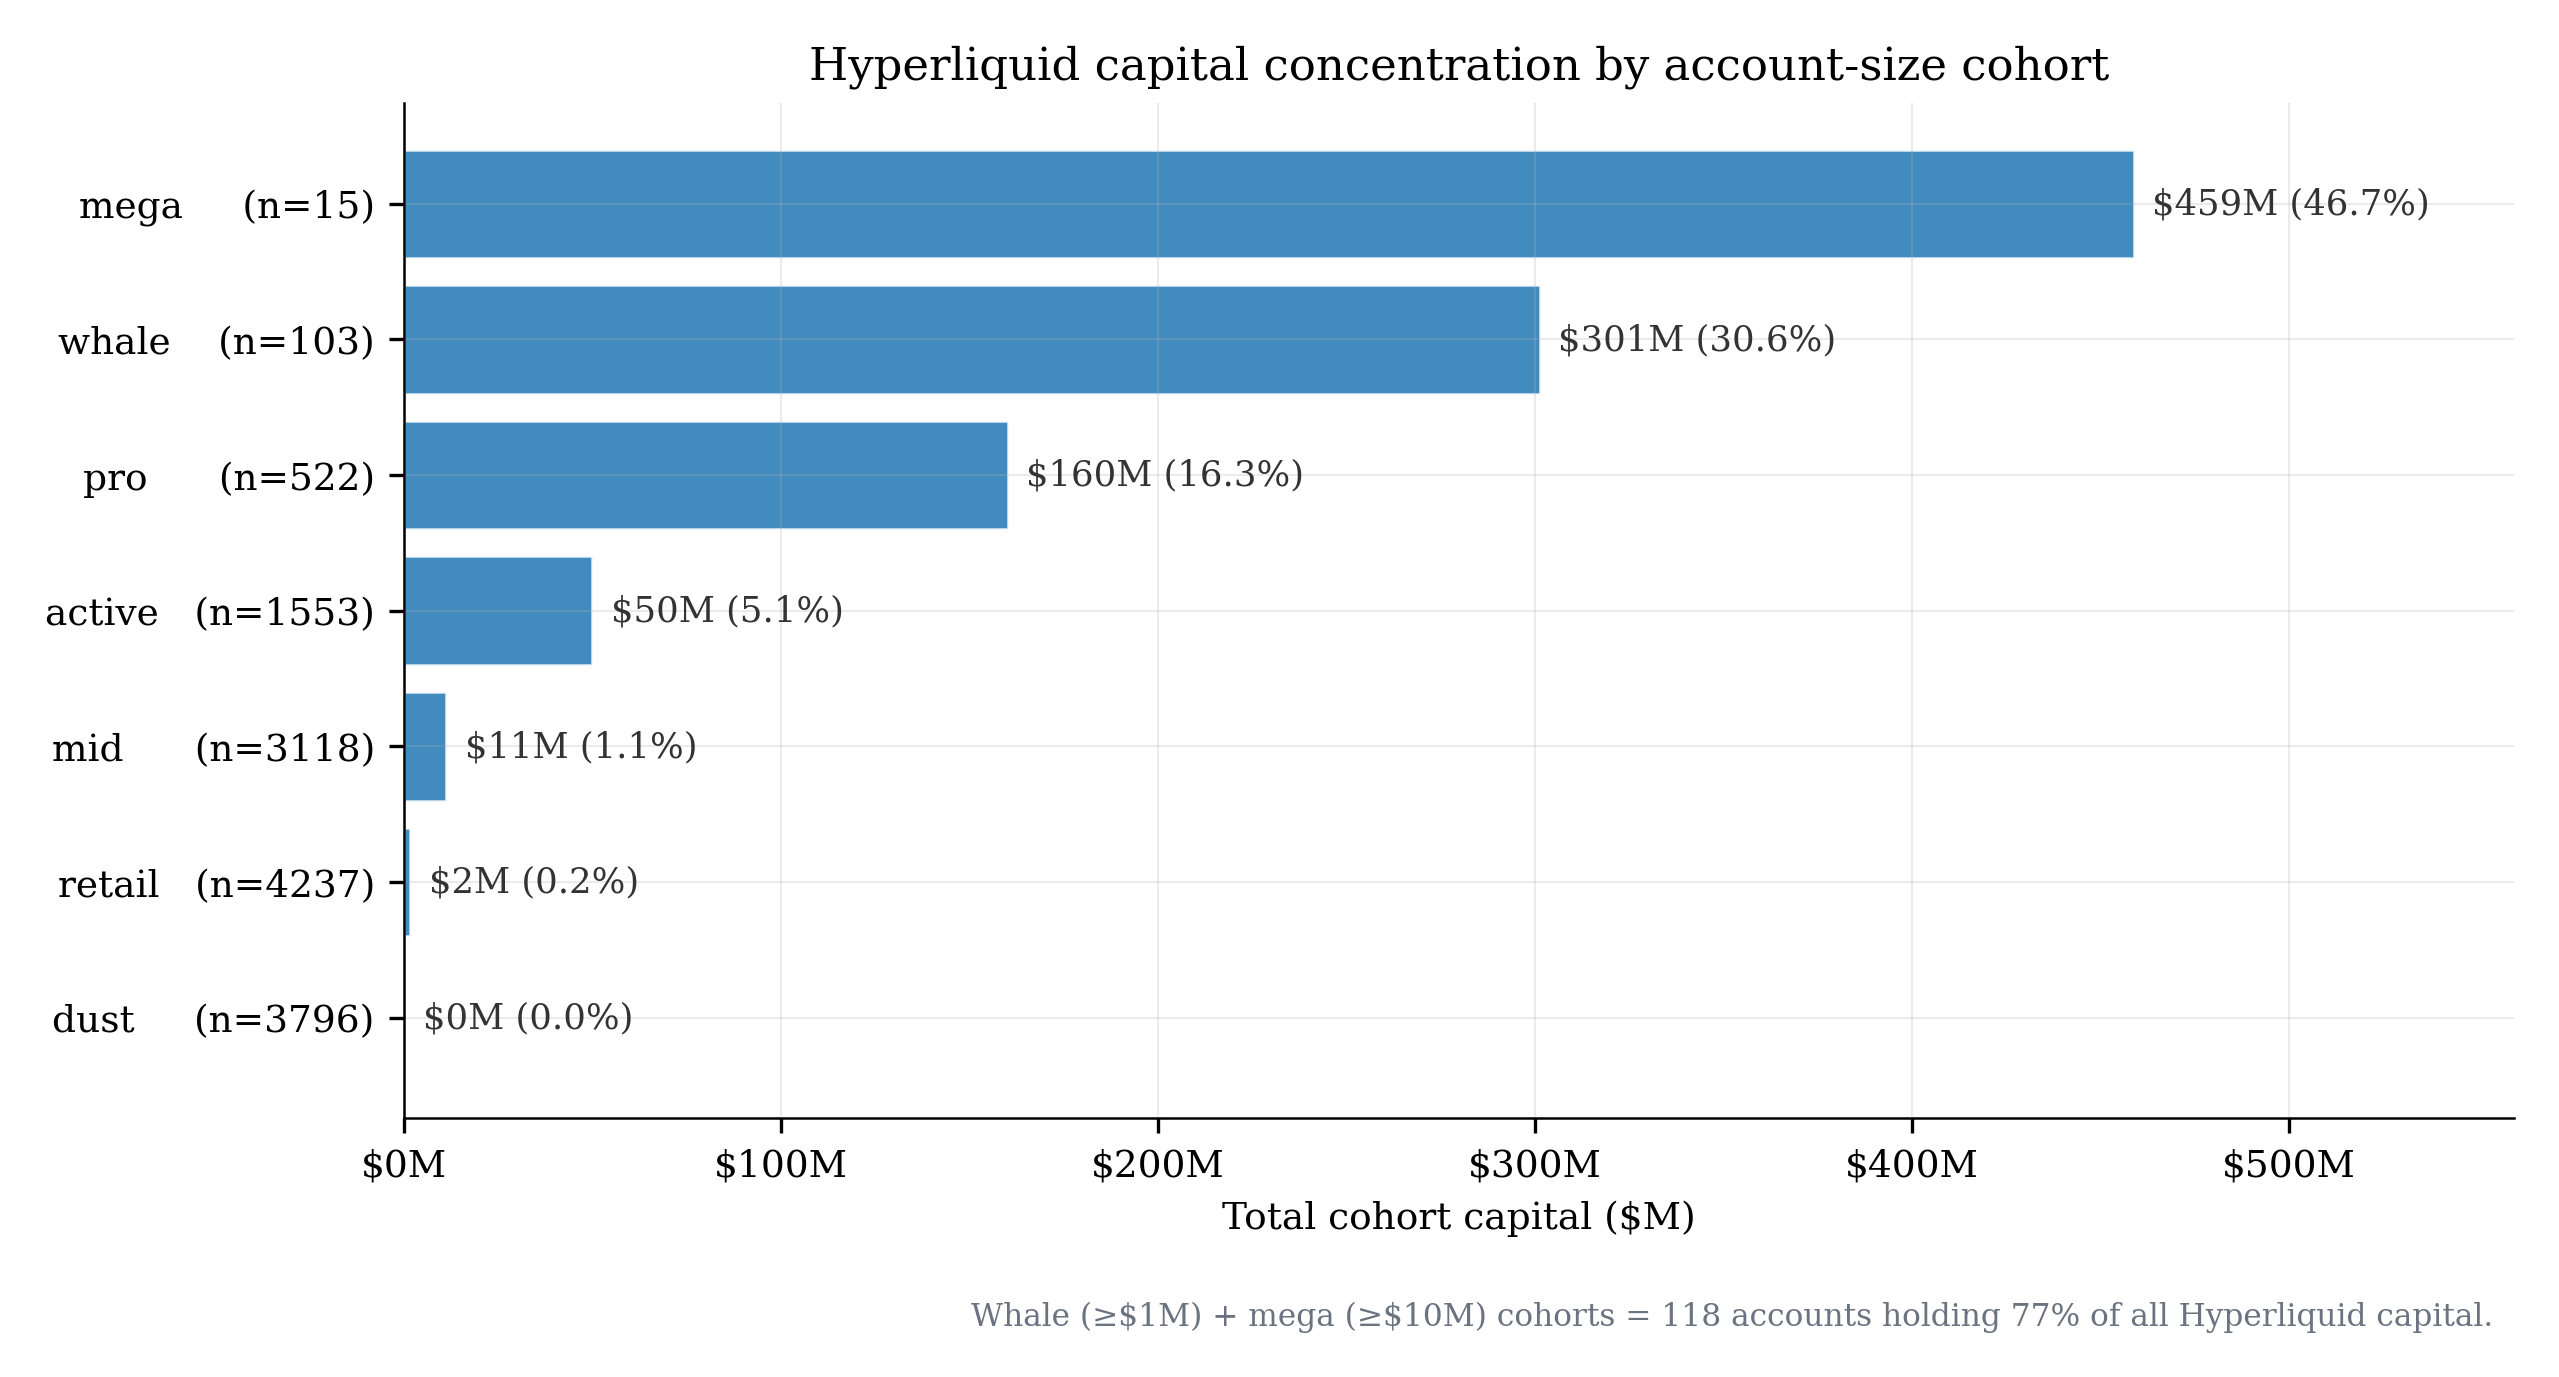
Now the more useful breakdown — where the modest-leverage capital lives. The capital concentration across account-size cohorts:
 |
|---|
| Capital concentration by account-size cohort across all long deployers. The mega + whale tiers (118 accounts, ≥$1M equity) hold 77% of all Hyperliquid capital. Pro (522 accounts, $100K–1M) hold an additional 16%. These three institutional-shaped cohorts hold 93% of total capital — but only some of them are actually running leverage. |
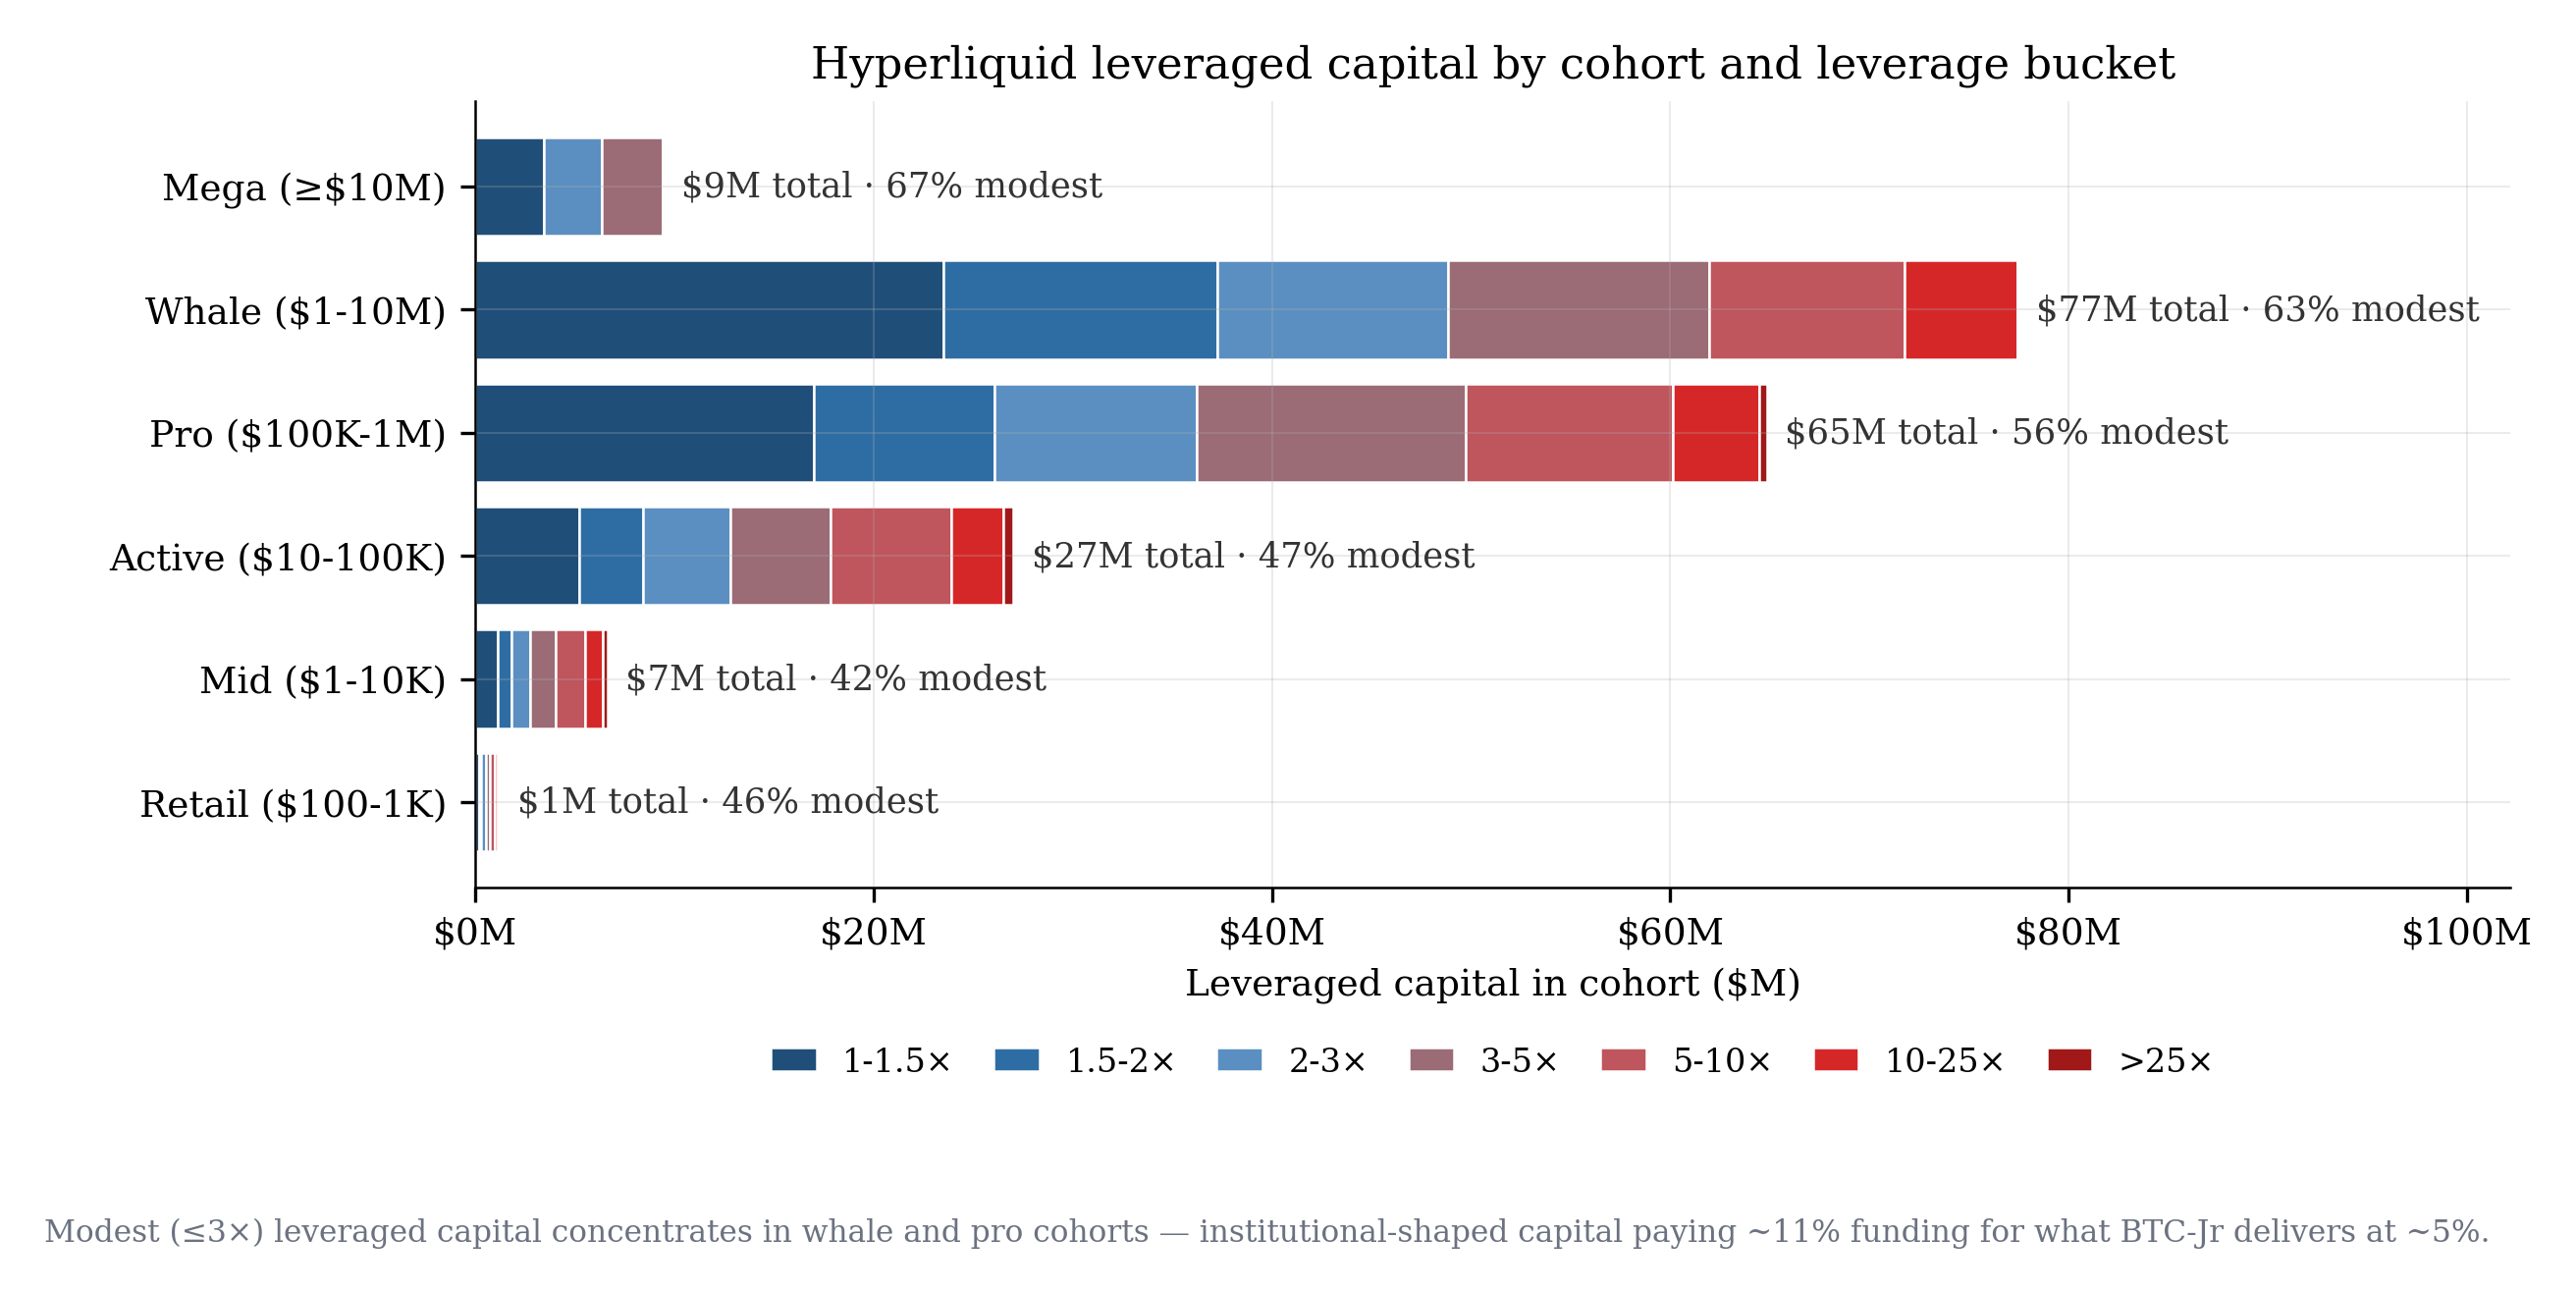
And then, within each cohort, how that capital is actually leveraged:
 |
|---|
| Leveraged capital by cohort and leverage bucket (L ≥ 1× only). Whale and pro cohorts hold the majority of leveraged capital — $77M and $65M respectively — and 63% and 56% of that capital is at modest leverage (≤3×). These are institutional-shaped accounts: large enough to require process and mandate justification, small enough in count (128 + 859 accounts) to be addressable as a market. They are running modest leverage on a venue where modest leverage is the most expensive product they could buy. |
The whale and pro cohorts hold $85M of modest-leverage capital between them — out of $107M total modest-leverage capital across all cohorts. This is the addressable surface: a small number of well-capitalized accounts, holding moderate-leverage long exposure, paying perp funding rates structurally designed for short-duration speculative use. They are exactly the holder profile 2factor’s productive-band architecture is designed to serve — and they are already paying premium pricing to use the wrong product.
What the cost looks like
The cost of leverage on perps is the funding rate, paid on the notional position size. This is a critical detail that the cultural framing of “leverage is cheap” obscures. Funding is charged on notional, not on equity — which means at higher leverage levels, the cost per dollar of equity scales linearly with leverage.
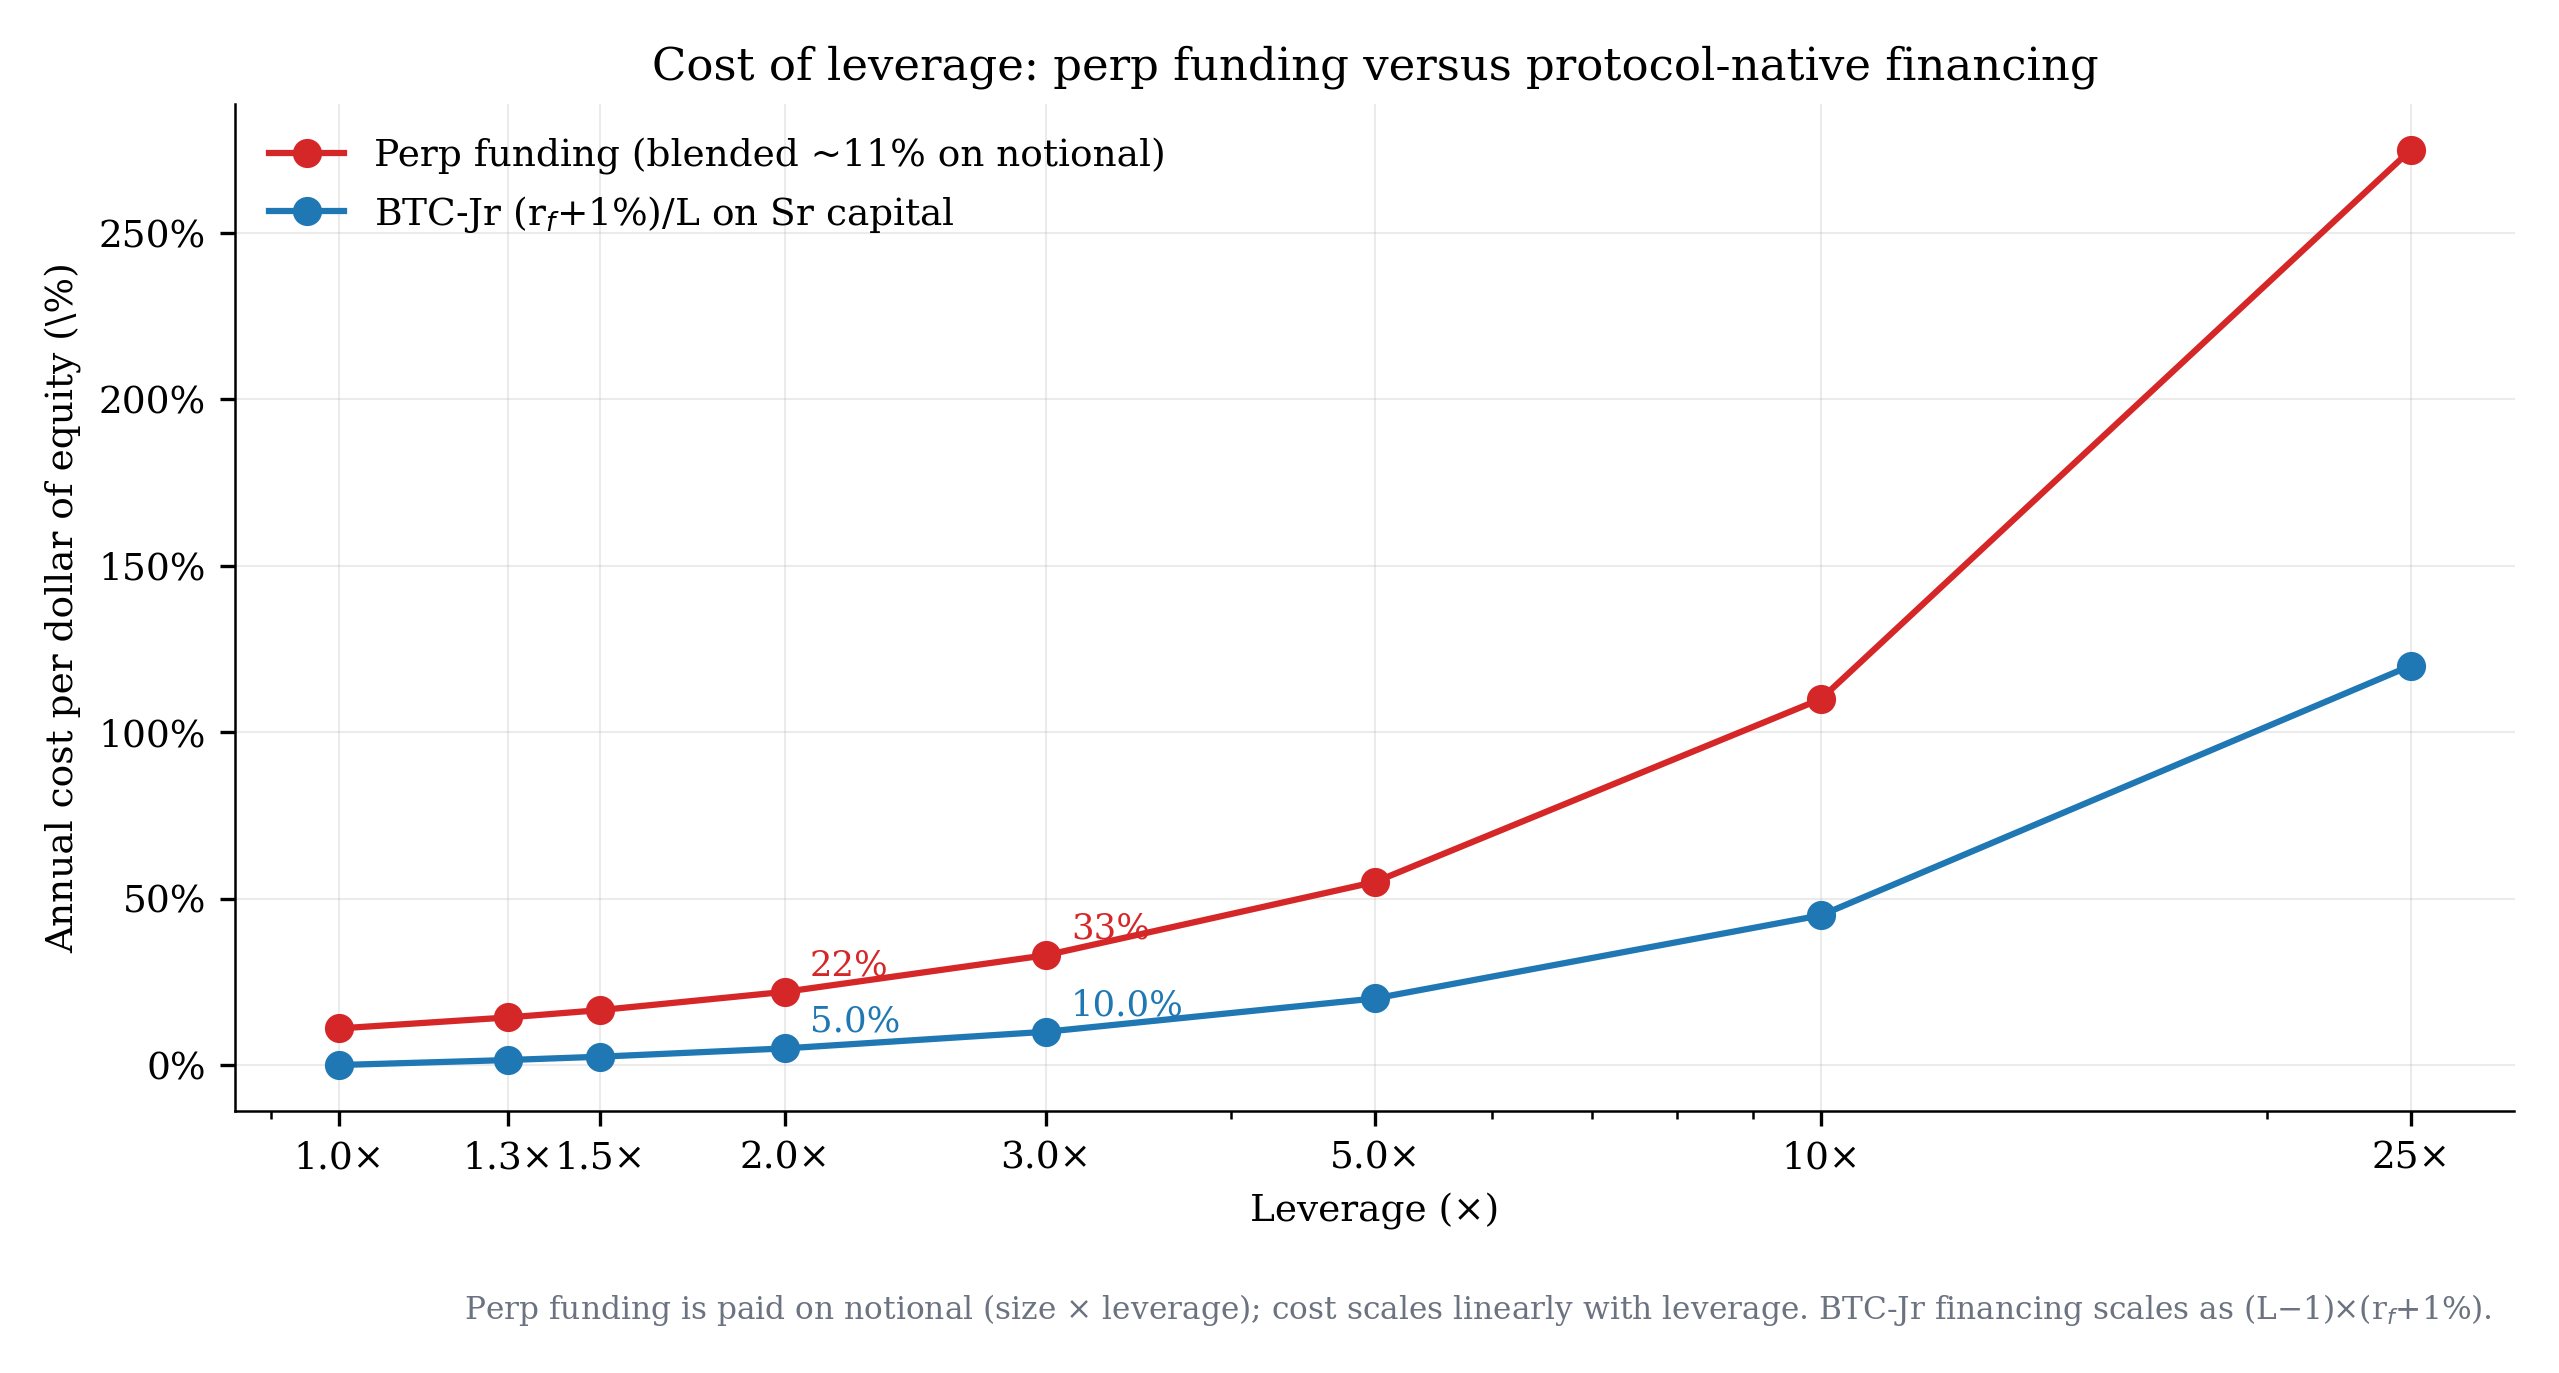
At a blended ~11% annualized funding rate (the rough cross-exchange average across the past 24 months, with cycles ranging from -10% during deleveraging to >50% during euphoric bull markets), the cost per dollar of equity scales as:
- 1× leverage: 11% on equity (full spot exposure)
- 2× leverage: 22% on equity
- 3× leverage: 33% on equity
- 5× leverage: 55% on equity
- 10× leverage: 110% on equity
- 25× leverage: 275% on equity
The funding cost on a leveraged perp position annihilates returns at any non-trivial leverage. Even at modest 2× leverage, the holder pays 22% per year just to maintain the position. The market price of high-leverage exposure on perps is, by construction, ruinous — which is why most capital systematically avoids it.
2factor’s perpetual-tranching architecture prices leverage fundamentally differently. The financing cost is the Sr-side yield: (rf + 1%) paid on the Sr capital borrowed, not on the entire notional. For a Jr position at leverage L, the borrowed Sr is (L−1) per dollar of Jr equity, so the annual cost per dollar of Jr equity is (L−1) × (rf + 1%). At rf = 4%:
- 1× leverage: 0% on equity
- 1.3× leverage: 1.5% on equity
- 2× leverage: 5% on equity
- 3× leverage: 10% on equity
- 5× leverage: 20% on equity
The cost comparison across leverage levels makes the structural advantage visible:
 |
|---|
| Annual cost per dollar of equity, perp funding versus BTC-Jr financing, across leverage. Perp funding scales linearly with leverage because it is paid on the full notional. BTC-Jr’s cost scales as (L−1) × (rf + 1%) — only on the borrowed Sr capital. The structural ratio is ~4–5× cheaper at any modest leverage level. At 2×, perp costs 22%/year vs BTC-Jr’s 5%. The cost saving compounds — and the risk profile is also fundamentally different, since BTC-Jr has no liquidation, no oracle dependency, no funding-spike risk. |
For the modest-leverage cohort that actually holds capital on Hyperliquid, this is not a marginal cost difference. The whale cohort’s $49M of modest-leverage capital pays roughly $9M/year in perp funding for exposure BTC-Jr would deliver for about $2M. The pro cohort’s $36M pays roughly $7M/year for what would cost $1.5M. These are large absolute numbers from a small absolute capital base, because perp funding is priced for short-horizon speculative use and modest-leverage holders are using it as a buy-and-hold instrument.
And cost is only the first dimension. The qualitative differences compound:
-
Liquidation risk. Perps liquidate any position that crosses the maintenance margin threshold. At 2× leverage on BTC, a 50% drawdown wipes the position entirely. BTC-Jr has no liquidation — by architecture, the Jr tranche absorbs the drawdown without forced exit.
-
Funding-rate volatility. The 11% blended is a long-run average; the path is what holders actually experience. During euphoric bull markets, funding can spike to 50% or 100%+ annualized. Holders who entered at moderate funding are not protected from regime shifts. BTC-Jr’s financing cost is bounded structurally — it cannot spike.
-
Oracle and mark-price risk. Perp positions are marked against an index price that can be temporarily manipulated, dislocated during stress, or used to trigger cascading liquidations. BTC-Jr’s NAV is protocol-defined and doesn’t depend on any oracle in the same way.
-
Counterparty risk. Perp positions carry exchange credit risk — FTX-era memory is recent enough to matter for institutional allocators. Protocol-native positions on BTC-Jr have only smart-contract risk, which is bounded and auditable.
-
Identity coding. Perps are culturally degen-coded, which constrains institutional adoption even when the structural use case is buy-and-hold. The same allocators who would happily hold a tranched leverage product cannot mandate-justify “we’re using Hyperliquid perps for our institutional BTC sleeve.” This is the same psychographic constraint the LETF and DAT essays documented in different markets.
What this measures
The point of this analysis is not to argue that perps are bad. Perps are a perfectly good product for the use case they were architecturally designed to serve — short-horizon directional speculation with deep liquidity and tight spreads. For that holder, perps work.
The point is that a meaningful share of the capital using perps is not that holder. The whale and pro cohorts on Hyperliquid hold $85M of modest-leverage long exposure between them — buy-and-hold leveraged-BTC capital that defaulted to perps because no protocol-native modest-leverage product existed when the allocation decision was made. The cost of that mismatch is observable, in published per-account data, in real dollars. The size of the mismatch is the lower bound on the addressable market for a properly architected buy-and-hold leverage primitive — lower bound because Hyperliquid is one venue, on-chain only, and the cohort almost certainly extends to CEX users whose per-position data is not publicly observable.
Three observations close the analysis:
Capital-weighted analysis surfaces the right cohort. Position-count and notional-weighting both produce the “perps are a degen casino” narrative because thousands of small high-leverage positions dominate those counts. Equity-weighting, restricted to actually-leveraged accounts, surfaces a different cohort: the 128 whale and 859 pro accounts whose modest-leverage long capital is buying buy-and-hold exposure through the wrong instrument.
Modest leverage is the majority posture among leveraged users. 58% of leveraged-cohort equity at ≤3× leverage, concentrated in whale (63% modest) and pro (56% modest) cohorts. This isn’t a niche use case hidden inside a high-leverage market; it’s the majority of capital in the institutional-shaped cohorts, paying premium pricing for premium it doesn’t need.
The cost savings would be immediate and large. At 2× leverage, the structural ratio is ~4× cheaper through BTC-Jr (5% vs 22% annualized). For an allocator holding $100M of leveraged BTC exposure at 2× through perps, the annual funding cost is ~$22M; the same exposure through BTC-Jr would cost ~$5M. That’s not an optimization — it’s an architectural correction that recaptures $17M per $100M of equity, every year, indefinitely.
The capital is already at modest leverage. It is already paying for the leverage. It is using the wrong product because the right product wasn’t accessible when the allocation decision was made. The architectural fix is what unlocks this capital — not a marketing push, not investor education, not a new product category. Just substitution of the leverage primitive at the same effective leverage level.
The buy-and-hold leveraged-BTC cohort that the prior three essays (MSTR substitution, BTC yield products, LETF holding periods) sized in adjacent markets is here too — concentrated in the institutional-shaped tiers of the largest on-chain perp venue. Make it legible, price it correctly, and the migration is straightforward.
Per-account leverage distribution data and methodology are at the Perp Leverage Distribution Explorer. Companion essays in the demand-source series: The Demand for Buy-and-Hold Leverage Is Already Visible — in LETF Holding Periods (LETF demand), How MicroStrategy Becomes Premium-Independent (DAT demand), and Moderate Leverage Outperforms Every BTC Yield Product (BTC yield demand). The architectural details of the buy-and-hold leverage primitive are in the Durable Leverage paper (Fragments Research, 2026).
Data & methodology
Per-account data source. Hyperliquid L1 fills data (24-hour windows) reconstructs the universe of perp-active addresses on each snapshot date. For each active address, the Hyperliquid clearinghouseState info endpoint returns current cross-margin equity, per-asset position notional, leverage, and liquidation price. The 2factor research team operates this collection at data.2factor.finance/perp-leverage-distribution.
Snapshot pooling. Four snapshot dates (2025-10-31, 2025-11-30, 2025-12-31, 2026-06-01) pooled to reduce single-day artifacts. Methodology and time-series detail at the dashboard.
Universe and cohort definitions. 64,863 unique perp-active accounts across the pooled snapshots; 13,347 of those accounts are classified as “long deployers” — they hold net long perp notional at snapshot time. Within long deployers, the leveraged subset is filtered to L ≥ 1×, where L = gross long notional ÷ account equity. Accounts at L < 1× hold more equity than long notional — they are cash-heavy with a directional tilt rather than running long-leveraged exposure, and they are excluded from the leverage-distribution analysis. The leveraged-long subset holds ~$186M in per-snapshot-average equity and ~$759M in long notional.
Leverage measurement. Per-account leverage = gross long notional ÷ account equity (cross-margin engine value, includes uPnL). Aggregate cohort leverage = sum of long notional ÷ sum of equity. This is the capital-weighted leverage on the leveraged-long subset, distinguished from per-position leverage (which weights by notional and is heavily biased toward retail high-leverage positions on small capital).
Cohorts. Account-size cohorts: dust (<$100), retail (<$1K), mid (<$10K), active (<$100K), pro (<$1M), whale (<$10M), mega (≥$10M). Cohort boundaries reflect institutional analyst conventions for crypto wallet-size segmentation. Per-cohort analyses use the leveraged-long subset (L ≥ 1×).
Funding-rate estimate. Blended ~11% annualized on BTC perps based on the average across major exchanges (Binance, Bybit, OKX, Hyperliquid, Deribit, Bitget) over the prior 24 months. Funding cycles considerably — sustained periods at 30–50% during euphoric markets, -10 to -20% during deleveraging events. The Schmeling, Schrimpf, and Todorov “Crypto Carry” paper (BIS Working Paper No. 1087, 2023) documents that crypto carry has reached >40% annualized at peaks but is “driven mainly by fluctuations in convenience yields” — not a stable cost.
BTC-Jr financing cost. Sr earns (rf + 1%) per dollar of Sr capital provided. For a Jr position at leverage L, borrowed Sr is (L−1) per dollar of Jr equity, so the cost per dollar of Jr equity is (L−1) × (rf + 1%). At rf = 4%, this is a bounded function of L, scaling linearly with (L−1) rather than with the full notional. Details in the Durable Leverage paper.
CEX extrapolation. Per-position leverage data is not publicly available for centralized exchanges. Order-of-magnitude implied modest-leverage cohort sizes use Hyperliquid’s distribution as the proxy applied to global BTC + ETH perp open interest (~$60–80B). This is a rough estimate; the on-chain Hyperliquid cohort may not be representative of CEX user composition, and institutional CEX participants likely skew toward even higher modest-leverage representation than the Hyperliquid distribution implies.
Sample limitations. The Hyperliquid data captures only the on-chain perp venue, which over-represents crypto-native users and under-represents institutional allocator capital that hasn’t migrated to on-chain venues. The directional finding — that a meaningful share of leveraged-long capital sits at modest leverage and pays premium funding — is robust; the precise dollar magnitudes for the global perp market deserve continued refinement as more data sources become accessible. The dust and retail cohorts are excluded from the cohort-leverage chart because their absolute capital amounts are too small to be meaningful.